Math and Art: Dancing Bubble Sort

This is a fun and whimsical demonstration of bubble sorting through dance!

http://www.youtube.com/watch?v=lyZQPjUT5B4

The dancers arrange themselves in numerical order in the same manner one would bubble sort an unordered list.  One by one, each number “compares” himself with the number on his left; if they are out of order, they switch places.  Make you’re way down the list, and start again at the front.  Repeat until no one switches places and voila! everyone’s in order!

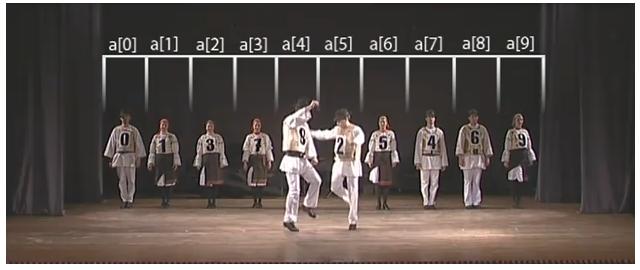
And just to be thorough, the troupe does dance-representations of Insert-Sort,  Shell-Sort, and Select-Sort algorithms as well!

NYT Presents: Jeterography

In celebration of Derek Jeter’s 3,000th major league hit, the New York Times ran a really cool infographic displaying the relative frequencies of where those 3,000 hits went.

http://archive.nytimes.com/www.nytimes.com/interactive/2011/06/15/sports/baseball/jeter-3000-hits.html

In addition to tracking where all of Jeter’s hits have gone, two graphics also compare his first 1,500 hits to his second 1,500 hits:  not surprisingly, the second 1,500 consists of fewer home runs and fewer hits to left field.  A similar graphic shows Alex Rodriguez’s hit patterns.

There are several other interesting data displays here, including year-by-year histograms for all 28 MLB players with 3,000 hits.

Beautiful Weather Graphs

“Beautiful Weather Graphs and Maps” are promised by WeatherSpark, and they deliver.

You can get local forecasts that show a number of projections bounded by highs and lows, or you can look at daily, monthly, or yearly trends that aggregate historical data.

In another section, a variety of interactive maps allow you to look at geographic trends in temperature, wind, humidity, and many other factors.

You can even look at long-term global temperature data!

A lot of information and representation to interact with and explore here.

Follow

Get every new post delivered to your Inbox

Join other followers: