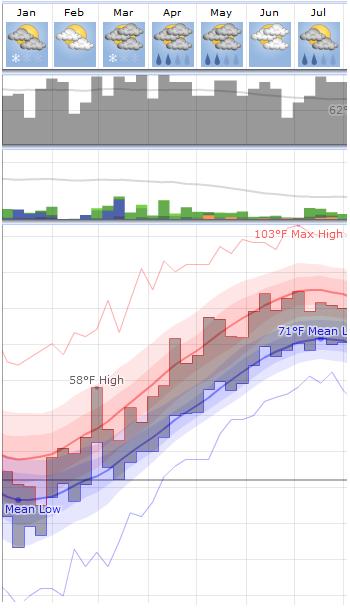
Beautiful Weather Graphs
 “Beautiful Weather Graphs and Maps” are promised by WeatherSpark, and they deliver.
You can get local forecasts that show a number of projections bounded by highs and lows, or you can look at daily, monthly, or yearly trends that aggregate historical data.
In another section, a variety of interactive maps allow you to look at geographic trends in temperature, wind, humidity, and many other factors.
You can even look at long-term global temperature data!
A lot of information and representation to interact with and explore here.
0 Comments