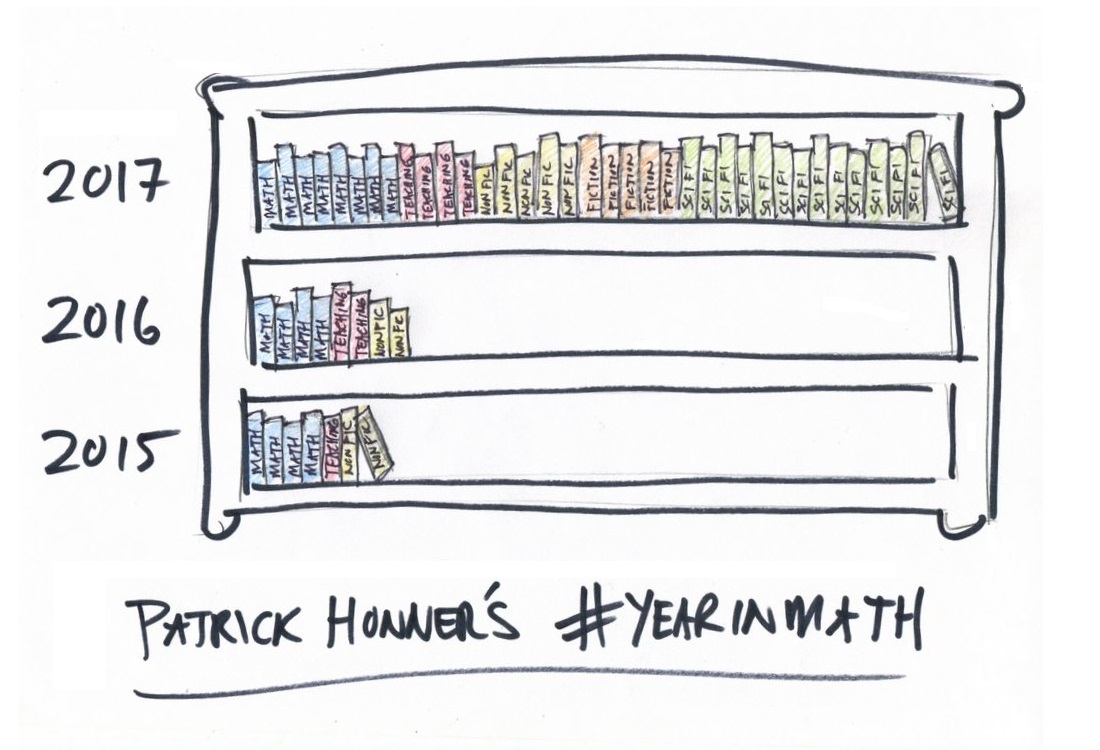
Dan Meyer recently shared a fun and telling graph describing his year in math. Inspired by Dan’s idea, and by a Math for America workshop with data visualization innovator Mona Chalabi, I created my own Year in Math entry. Though the real inspiration, I guess, came from the world events that made me want to read more books and less internet.
You can find more takes on the Year in Math theme on Twitter.
I think this could make for a fun student project. I hope the students agree!


