This is Not an Exponential Function
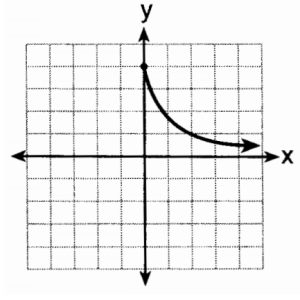
A question from the January 2014 Integrated Algebra Regents exam asks students to identify a graph showing exponential decay. This graph was the correct choice.
We regularly see terrible graphs on these exams: non-trigonmetric trig functions, functions intersecting their vertical asymptotes, and unscaled coordinate systems. So it comes as no surprise that this graph is not actually the graph of an exponential function!
First, note that all exponential functions have the form . Since this graph passes through the point (0,4), we immediately see that
.
Note also that the graph passes through the point (2,1). Thus, . We can now use this information to compute
.
Since , we see
. But
, and so
.
Taking the square root of both sides, we see that . Assuming
, we have
, and so
. But
, so we now know that
.
Notice, however, that the graph does not pass through the point (1,2)! Thus, this is not the graph of an exponential function.
Related Posts

4 Comments
Sue VanHattum · March 27, 2014 at 11:30 pm
I wonder if it might be exponential decay with a shifted horizontal asymptote (y=ab^x+c).
Joshua Zucker · March 28, 2014 at 1:41 am
Sue, I don’t think so: the amount of decrease for each unit of x still has to make a geometric series and here the decrease between x=3 and x=4 looks too big — almost equal to the one before it, while the previous ones are changing at a ratio of less than half the decrease for each unit of x.
Sue VanHattum · March 29, 2014 at 5:22 pm
>the amount of decrease for each unit of x still has to make a geometric series
Yes. The line is so thick that it’s hard to tel, but I think you’re right.
jkhoward · November 5, 2023 at 1:26 am
the graph doesn’t go through the point (2,1) either. The thickness of the line/arrow makes it so the point is covered, but if f(2) were 1 then the sort of ‘infinitely thin central spine’ of the arrow would go through the (2,1). Here it looks the intersection of the gridlines is just barely touched by the outside of the thick plot line.