Introducing Painless Statistics

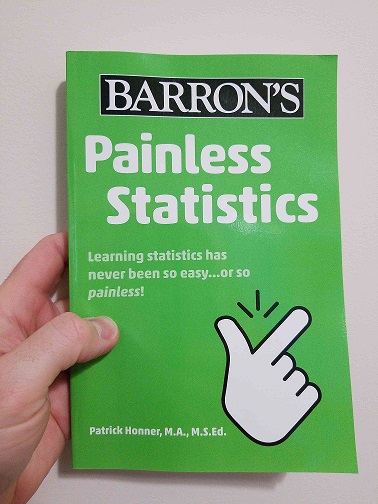
I am thrilled to announce the release of my new book, Painless Statistics!

Painless Statistics, an entry in the Barron’s Painless series, is written to serve as both a supplementary resource for students taking statistics in school as well as a stand-alone resource for adults who are learning (or re-learning) stats on their own.

Painless Statistics begins with an example of working with data, and covers everything from summary statistics and representations of data to sampling distributions and statistical inference. The book also includes plenty of problems that get you thinking about and applying the important ideas in each chapter.

My hope is that Painless Statistics can be a useful resource for middle school, high school, and even college students learning statistics, as well as for lifelong learners interested in understanding the fundamental mathematical ideas at the intersection of statistics, probability, and inference.

I also think the book would be a great resource for any math teacher who might not see themselves as a statistics teacher but would like to better understand the fundamental ideas in statistics. If by reading Painless Statistics you learn 10% of what I learned by writing it, I think you’ll find it a worthwhile purchase.

If you or someone you know is learning statistics, or would like to learn statistics, please consider picking up a copy of Painless Statistics! It will be available in bookstores everywhere starting June 7th, and you can also order it online. I’ve included the Table of Contents below, and you can take a look inside at the first chapter here.

Painless Statistics Table of Contents

Chapter One: An Introduction to Data

Chapter Two: Data and Representations

Chapter Three: Descriptive Statistics

Chapter Four: Distributions of Data

Chapter Five: The Normal Distribution

Chapter Six: The Fundamentals of Probability

Chapter Seven: Conditional Probability

Chapter Eight: Statistical Sampling

Chapter Nine: Confidence Intervals

Chapter Ten: Statistical Significance

Chapter Eleven: Bivariate Statistics

Chapter Twelve: Statistical Literacy
The All 1s Vector

Here’s a short post based on a Twitter thread I wrote about a very underappreciated vector: The all 1s vector!

Image

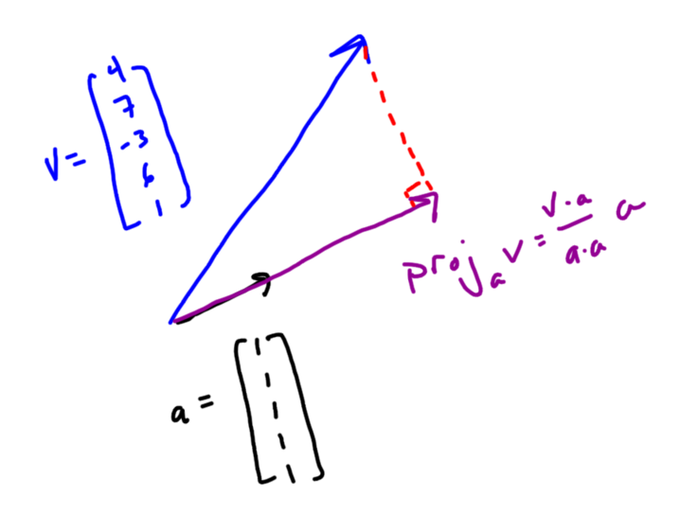
Every vector whose components are all equal is a scalar multiple of the all 1’s vector. These vectors form a “subspace”, and the all 1’s vector is the “basis” vector.

Let’s say you have a list of data — like 4, 7, -3, 6, and 1 — and you put that data in a vector v. An important question turns out to be “What vector with equal components is most like my vector v?”

To answer that question you can *project* your vector onto the all 1’s vector. You can think of this geometrically — it’s kind of like the shadow your vector casts on the all 1’s vector. There’s also a formula for it that uses dot products.

Image

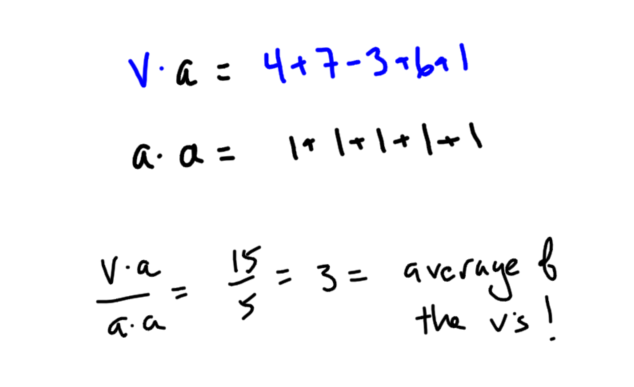
Because of the way the dot product works and the special nature of the all 1’s vector, v•a is the sum of the elements of v and a•a is the number of elements in v. This makes (v•a)/(a•a) the mean of the data in v!

Image

Since 3 is the mean of your data, the vector with equal components that is most like your vector is the all 3’s vector. This makes sense, since if you’re going to replace your list of data with a single number, you’d probably choose the mean.

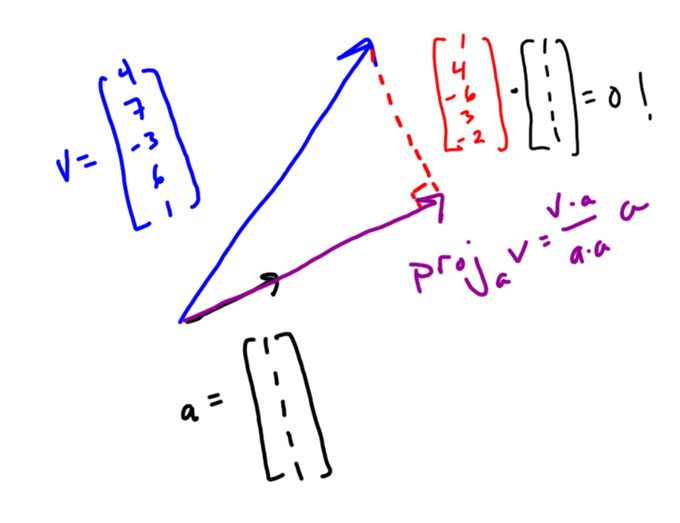
Now the cool part. Look at the difference in these two vectors: These are the individual deviations from mean for each of your data points, in vector form!

Image

And geometrically this vector of deviations is perpendicular to the all 1’s vector! You can check this using the dot product.

Image

So data can be decomposed into two vector pieces: one parallel to the all 1’s vector with the mean in every component, and one perpendicular to that with all the deviations. You can see hints of independence, variation, standard deviation lurking in this decomposition.

You can check out the original thread on Twitter here, including some very interesting replies!

Related Posts

Statistics in the STEM Classroom

I will be participating in the upcoming webinar Statistics in the STEM Classroom, hosted by the National Museum of Mathematics. During the webinar I’ll present a lesson I developed as part of a joint program between MoMath and the Brookhaven National Laboratory.

This summer a small group of math and physics teachers attended workshops with Dr. Allen Mincer, a particle physicist from NYU. Dr. Mincer discussed the mathematics, statistics, and physics involved in the development and operation of the Large Hadron Collider (LHC), the world’s largest particle accelerator. Teachers were then tasked with developing classroom lessons inspired by Dr. Mincer’s workshops.

The lessons will be shared during these MoMath workshops, the first of which is Monday, December 9th. The workshops are open to the public, and are free for New York State Master Teachers. You can find out more about the webinar and register here.

Media Literacy Week Panel

Tomorrow I’ll be on a panel discussing quantitative literacy as part of Media Literacy Week. The focus will be data and science misinformation, and the panel discussion will run as part of the National Science Teachers Association’s Teacher Tip Tuesdays series.

This is a joint project of the National Science Teachers Association (NSTA), the National Council of Teachers of Mathematics (NCTM), Education Development Center (EDC), and the National Association for Media Literacy Education (NAMLE). Registration is free, and you can find out more here.

UPDATE: You can find the full video of the webinar here.

NPR — Teaching Math Using the Coronavirus

I make a brief appearance in this NPR story about teaching using the coronavirus. In “Teacher Uses Coronavirus for Math Lessons”, reporter Emily Files profiles a teacher in Wisconsin who is using the coronavirus epidemic to get his middle school math students thinking about data and rates of change. Files interviewed me a about the lesson I wrote for the New York Times Learning Network on “Dangerous Numbers” (available here).

Follow

Get every new post delivered to your Inbox

Join other followers: