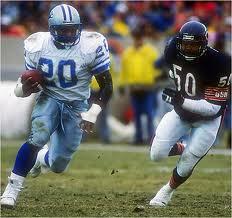
 In an attempt to reduce player injury, the National Football League has modified their kickoff rule for the 2011 NFL season. Kickoffs, which occur after scores and at the beginning of each half, will now be taken from a team’s 35 yard line. Moving the kickoff five yards downfield may seem like a minor change, but significant consequences have already been seen in pre-season games.
As expected, the number of “touchbacks”, or un-returned kickoffs, has dramatically increased. The kickoff return is an exciting play in football, and decreasing the number of returns has some fans and observers worried that the games won’t be as fun to watch. As a football fan, I see this as a legitimate issue, but as a quantitative-minded person, my first thought was “How will this new rule affect scoring?”.
I looked at AdvancedNFLStats.com, an excellent collection of unique quantitative analysis by Brian Burke. In a post examining the value of a touchback, Burke creates a graph of expected points by 1st down field position. For example, the ordered pair (60, 1.2) on the graph represents the following piece of information: teams starting on their own 40-yard line will score about 1.2 points per possession on average.
It’s no surprise that the graphs displays a negative correlation: as distance from goal increases, expected points decrease. But it is somewhat surprising how linear the relationship looks. A rough estimate suggests that the slope of the line is about -1 / 20; this means that for every additional 20 yards of distance from the goal, the team will, on average, score one less point per possession.
This is where the new kickoff rule comes in. More touchbacks means more drives starting on the 20 yard line, and this will likely decrease the average starting field position for both teams. More yards to goal means less points scored per possession. The question now is, how much less?
Well, the average starting field position after a kickoff around the 27 yard line. In the 2011 pre-season, 34% of kickoffs were touchbacks, up from 16% last year. A touchback results in a team starting at the 20 yard line.
If the overall average starting position is the 27 yard line, we can use the following equation to find the average starting field position for a non-touchback kickoff:

Solving for  gives us the average starting field position after a non-touchback kickoff, which is around the 28.33 yard line.
Let’s assume that non-touchback kickoffs will be unaffected by the rule change and so, on average, will start at around the 28.33 yard line. If the touchback percentage for the regular season rises to 34%, this means that the new average starting field position after a kickoff will be

This comes out to around 25.5. This suggests that the new rule will cost each offense, on average, about 1.5 yards of field position per kickoff. With around ten kickoffs per game, this translates into 15 total yards of lost field position, and that equals about 0.75 total points lost per game.
It’s possible that the rule change could affect non-touchback kickoff returns as well, as the coverage team may now have a greater advantage. A reduction in non-kickoff returns by, say, 3 yards, would mean the overall average starting field position after a kickoff would be

That is, around the 23.5 yard line. This could translate into almost two points less per game!
This is an admittedly rudimentary analysis, but it’s an easy way to start a quantitative investigation of this rule change. And it will make watching the scores this year even more fun!
Related Posts
 After producing the third-lowest home run total in the National League, the New York Mets are altering the dimensions of their home park, Citi Field.

