MfA Workshop — Stats and Sims in Scratch

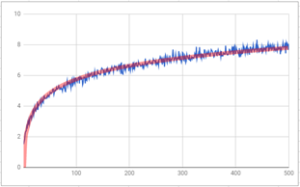
Tonight I’ll be running a workshop, “Stats and Sims in Scratch”, for teachers at Math for America. In this workshop we will develop basic computational tools for exploring elementary and advanced problems in probability, and implement and apply statistical procedures via programming.

This workshop is a product of my ongoing efforts to integrate mathematics and computer science in my classrooms. The study of probability creates natural opportunities to bring in tools from computer science, which create alternate pathways to understanding concepts in probability through generating, managing, and analyzing data.

I will also be presenting on this topic at the NCTM Annual Meeting in Washington, DC in April of this year. Feel free to contact me for more information about this particular workshop or my other work with mathematics and Scratch.

Related Posts


Statistics and Skew Dice

skew diceTo help our department prepare for the impending content shifts in our Algebra 2 course, I recently gave a demonstration lesson in probability and statistics.  I was very lucky that my Skew Dice had just arrived!

Virtually everyone who encountered the skew dice had the same, immediate reaction:  are the dice fair?  This created an instant, authentic context for developing a wide variety of concepts and techniques in probability and statistics.

This simple question catalyzed natural mathematical conversations about what fairness means and how we might measure it.  Transitioning from the intuitive notion that “each face should appear the same number of times” to a clear, rigorous mathematical characterization allowed us to wrestle with some fundamental statistical notions in a meaningful way.

I asked participants to propose tests for fairness, and then had them perform a test I had decided on ahead of time: roll the die 100 times and report the number of sixes.   Before they began, I asked participants to consider how many sixes they would expect, and what numbers of observed sixes might suggest to them that the die was unfair.

The groups performed their tests and shared their data.  We compared our results to our earlier intuitions, and talked about some ways we could interpret the data, touching on the rudiments of hypothesis testing.

A strength of this activity is that it creates opportunities to discuss modeling, experimental design, and data collection in meaningful ways:  What assumptions did we make in our definitions of fairness?  What assumptions underlie the test we conducted?  What consequences follow from our choices about what data to collect, and how to collect it?  All of these questions are interesting, important, and profoundly mathematical.

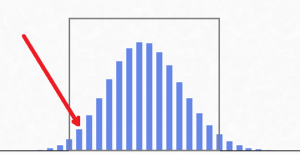
Another strength is that it engages participants in real mathematical inquiry, which I experienced firsthand when I performed the experiment myself.  I ended up with an unusual number of 6s.

skew dice histogram

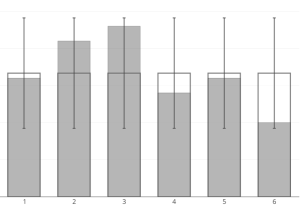
This prompted me to follow up with some more tests.

skew dice chi squared

In the end, I felt confident with my conclusions, but the anomalous result had me reflecting on the process.  As I thought about performing the test, I recalled frequently rolling the same number several times in a row.  Luckily, the manner I chose to record the data allowed me to investigate how frequently I rolled consecutive numbers.  The results were very surprising!  This led me to ask, and contemplate, more questions about the skew dice.  This is exactly the kind of mathematical experience I want students to have.

Skew dice are beautiful objects and great mathematical conversation starters.  I highly recommend picking some up from The Dice Lab.

Field Goals, the Super Bowl, and Mathematical Models

There has been a tremendous increase in the use of mathematical analysis to make policy, inform organizational decisions, and explain news and events.  I generally think this is a positive thing:  I understand that math gives us a powerful set of tools for understanding and processing the world.  But I also understand the limitations inherent in mathematical modeling.

All mathematical models rely on assumptions that limit their impact.  Mathematicians are typically aware of the assumptions about objects, relationships, and contexts that their models make.  Politicians, journalists, and others who invoke mathematics to make a point seem less aware.  This often leads to bold, unjustified claims based on what “the math” has told them.

An inconsequential but illustrative example of this occurred during Super Bowl 49.

At the start of the second half with the game tied at 14, Seattle drove into scoring position, and faced a 4th-and-1 at New England’s 8 yard line.  Seattle basically had two options:  kick the field goal (a high-percentage play for 3 points), or try to make a 1st-down, and ultimately a touchdown (a lower-percentage play for 7 points).  Seattle opted for the field goal and went ahead 17-14.

Lots of people on Twitter second-guessed the decision, including The Upshot’s David Leohnardt.

Here, David Leonhardt is applying a simple expected value argument.  “Going for it” on 4th-and-1 at the opponent’s 8-yard-line likely produces more total points in the long run than kicking field goals, which suggests that Seattle should have gone for it.  It’s not a bad argument; in fact, I used a similar analysis on the NFL’s new overtime rule.

But in order to apply this argument, it’s important to understand what assumptions this model makes.  For example, this model assumes that the amount of time remaining in the game is irrelevant.  Of course, it’s not:  it’s easy to construct a situation in which “time remaining” is the determining factor in the kicking a field goal (say, the game is tied, and only seconds remain).

This model also assumes that all points are of equal worth.  But they aren’t.  Depending on the game situation, the extra four points a touchdown gives you may be irrelevant, or of significantly less value than the three points the field goal gives you (imagine a team up by six points late in the game).

There are lots of factors this analysis does not consider.  This doesn’t mean that the expected value argument is invalid.  It just means that, like all mathematical models, what it says depends on the assumptions it makes.  And the more we use mathematical models to drive our decisions, the more important it is to be clear about the assumptions that are made and the consequences they entail.
Teaching Math Through March Madness

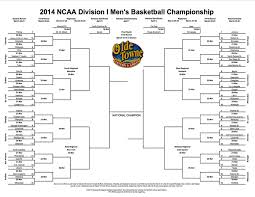
ncaa bracket 2014My latest piece for the New York Times Learning Network leverages March Madness to explore some basic ideas in counting and probability.

Begin by having students explore how to count the number of possible brackets. Start by analyzing a four-team bracket, say, with Team A playing Team B and Team C playing Team D in the first round. Have the students directly list the eight possible tournament outcomes: For example, A beats B, D beats C, and then D beats A is one such outcome. The use of tree diagrams may be helpful in representing the possible brackets.

Then ask students to predict and explore how many brackets are possible with an eight-team tournament. There are 2 raised to the 7th power, or 128, such brackets. One way to see this is first by noting that eight teams in a single-elimination tournament will end up playing seven total games: Seven of the eight teams must be eliminated, which requires that they lose a game.

I’m glad I could make a small contribution to the Math Madness surrounding March Madness!  You can find the entire lesson here.

Google and Conditional Probability

Conditional probability is one of my favorite topics to teach.  Whereas normal probability calculations simply compare favorable outcomes to total outcomes, conditional probability allows us to consider the impact of certain knowledge on the likelihood of those outcomes.

For example, the probability of rolling a 6 on a six-sided die is 1/6, but if it is known that the number showing is greater than 3, then the conditional probability that a 6 is rolled is 1/3.

There are many applications of conditional probability, but a recent “Math Encounter” from the Museum of Math made me aware of an application of conditional probability that all of us see on a regular basis:  Google search autocomplete.

Suppose I type in the search term “under”:

Here, Google is trying to autocomplete my search query.  In essence, Google is trying to guess the next word I’m going to type.  How does it make its guess?  It computes a conditional probability!

Google has a lot of data on when words follow other words.  When I enter “under” into the search bar, Google looks for the word/phrase with the highest conditional probability of being next.  Here it turns out to be “armour”; the word with the second highest conditional probability is “world”, and so on.

Naturally, as more information is provided, the conditional probabilities change.

 A fascinating, and perhaps surprising, application of a powerful mathematical idea!

Follow

Get every new post delivered to your Inbox

Join other followers: