Remote Learning — Week 8

Last week the New York Times published the opinion piece “Why I’m Learning More With Distance Learning Than I Do in School“, by Veronique Mintz, an 8th grade student from New York City. As the title suggests, Ms. Mintz not only enjoys the current distance learning model, but actually prefers it to being in school.

It’s a terrific essay that offers teachers plenty to think about, even if it isn’t a flattering portrayal of their work. Important questions about classroom management, collaborative learning, and instructional design are raised. At it’s heart the piece touches on a very complicated question: Where does a teacher focus their effort?

It’s a thoughtful and well-written piece, and Ms. Mintz deserves praise for it. But I don’t believe that her experience is anywhere near typical. Which led me to submit the following letter to the editor.

It’s wonderful that Ms. Mintz is finding success during emergency remote learning. Many of my students are also doing well. I’d even say some are thriving. What they and Ms. Mintz are doing isn’t easy, and it’s inspiring. And not just to us teachers.

But many students are missing the structure of school and the collaboration of the classroom. They miss the school leaders who greet them at the door with a smile. They miss the teachers who can read slumped shoulders and slight hesitations and say just the right thing to get them back on track. I hope Ms. Mintz understands that despite great efforts, many students are not finding the same kind of success she is. More importantly, I hope the readers of the New York Times understand that, too.

I appreciate a good opinion piece, but certain kinds of opinions on education are far more likely to make the pages of the NYT than others. As I mentioned on Twitter, these Op Eds always leave me with questions, and not just about education.

Related Posts

7 Ways to Explore the Math of the Coronavirus Using the New York Times

My latest piece for the New York Times Learning Network is “7 Ways to Explore the Math of the Coronavirus Using the New York Times”, a collection of ideas for using NYT articles, infographics, and interactives to explore the mathematics underlying the current coronavirus epidemic.

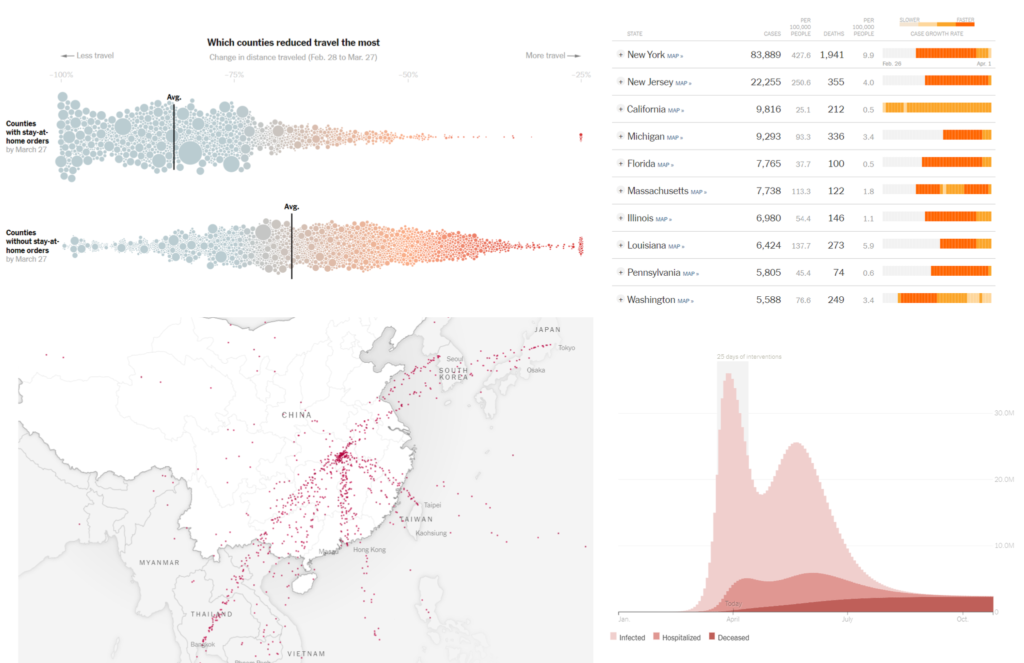
The opportunities range from statistical literacy to network theory. Here’s an example of some data analysis you can engage in using a wonderful NYT interactive:

By using sliders to change, for example, the level of intervention (e.g., moderate or aggressive) or the length of intervention (e.g., 14 days or 60 days), students can see how outcomes change. And, by playing with the model, they will be able to answer questions like: “What is the impact of shortening our social distancing period?” or “What happens when we delay the start of our interventions?”

The full article is freely available on the New York Times Learning Network.

Dangerous Numbers

My latest piece for the New York Times Learning Network is inspired by a recent NYT editorial from mathematician and author John Allen Paulos. In “We’re Reading the Coronavirus Numbers Wrong”, Paulos opens with a warning about our addiction to up-to-the-minute:

Numbers have a certain mystique: They seem precise, exact, sometimes even beyond doubt. But outside the field of pure mathematics, this reputation rarely is deserved. And when it comes to the coronavirus epidemic, buying into that can be downright dangerous.

The lesson uses Paulos’s essay to help frame student analysis of new reporting. By asking questions like “Is the data what we think it is?”, “Does the data mean what we think it means?”, and “Is there other data that could help put this in context?”, students can improve their quantitative literacy skills. And maybe spot a few “dangerous numbers” of their own!

The full lesson is freely available at the New York Times Learning Network.

Teaching with the ASA’s Election Prediction Contest

My latest piece for the NYT Learning Network gets students using statistics and data analysis to create entries for the American Statistical Association‘s Election Prediction contest.

The ASA’s contest invites students to predict the winner of each state in the upcoming Presidential election, as well as the vote-share for each major party candidate.  My piece offers students some basic strategies to consider when making their predictions.

A straightforward strategy for predicting the winner of each state would be to use the latest aggregate polling data from a reputable source. The New York Times offers a state-by-state probabilities chart that provides a projected outcome for each state as determined by each of several media outlets, including The Times itself as well as FiveThirtyEight and Daily Kos, among others.

Students could choose one of the outlets to use as the basis for their predictions, but to satisfy the written requirement of the contest they should be prepared to provide some justification for their choice. For example, they could research each outlet’s methodology and explain why they found one more compelling than another (perhaps more polls are used from each state, or the predictions have been more stable over time).

In addition to introducing students to several basic prediction strategies, there are plenty of links to online resources where students can explore visualizations of voting trends and research historical voting data.  The lesson is freely available here.

The ASA’s contest ends October 24th, so get predicting!

Who Needs Math? A Student Responds

For a political science professor, Andrew Hacker is surprisingly familiar to math teachers.  His 2012 New York Times Op-Ed “Is Algebra Necessary?” generated lots of conversation in the math education community, including several pieces from me:  “N Ways to Use Algebra With the New York Times” in NYT Learning, and “Replace Algebra with Algebra?”.

Professor Hacker is back in 2016 promoting a new book, and in a recent NYT interview he revives his anti-math arguments from four years ago:  math is not really necessary for jobs; it’s too hard; it prevents students from graduating.

I saw the piece and didn’t feel the need to respond.  There was nothing new, and I’d said what I wanted to say here.

But I was pleasantly surprised when I saw this letter-to-the-editor, written by a high school student, published in the February 19th edition of the New York Times.

In “Who Needs Math? Not Everybody” (Education Life, Feb. 7), Andrew Hacker, who teaches quantitative reasoning at Queens College, says that since only 5 percent of people use algebra and/or geometry in their jobs, students don’t need to learn these subjects.

As a high school student, I strongly disagree.

The point of learning is to understand the world. If the only point of learning is job preparation, why should students learn history, or read Shakespeare?

And while your job may never require you to know the difference between a postulate and a theorem, it will almost certainly require other math-based skills, like how to prove something or how to understand a graph.  

And my surprise turned to delight when I realized that the author is a 9th grader in my Geometry class!

While her love of mathematics and her wonderful attitude toward learning certainly predate my Geometry course, I am very proud to see reflections of our classroom in her letter.

You can read the full text of her letter here.

Related Posts


Follow

Get every new post delivered to your Inbox

Join other followers: