How to Optimize Traffic

Yesterday while stuck in traffic I noticed that the dynamically priced express lanes were nearly empty *and* the price to use them was quite high. This seemed odd, as I thought that if the lanes weren’t being used, the price would come down to encourage drivers to use them. It seems like a straightforward optimization problem.

The twist is that the express lanes are privatized, so the operators price the lanes to maximize profit, not, as I had assumed, to optimize traffic flow. This different objective lead to different behavior in the system.

This is a nice, simple example of how every applied math problem depends on many different assumptions, some of which might be hidden from view. It’s also a good example of how math can be used to better understand the different approaches to managing public resources.

Note: I originally posted this on Mastodon. Jeremy Kun posted some nice resources in response, including this paper surveying the research on the topic and a link to the Transportation Research Board’s Managed Lanes Committee.
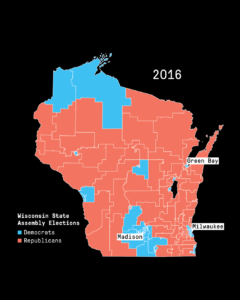
Investigating the Math Behind Biased Maps

My latest piece for the New York Times Learning Network gets students investigating the mathematics of gerrymandering.  Through applying geometry, proportionality, and the efficiency gap, students explore the notion of a “workable standard” for identifying and evaluating biased electoral maps.

Here is an excerpt:

Math lies at the heart of gerrymandering, in which the shapes of voting districts and distributions of voters are manipulated to preserve and expand political power.

The strategy of gerrymandering is not new… However, new, sophisticated mathematical and computer mapping tools have made gerrymandering an even more powerful way to tilt the playing field. In many states, where the majority party has the authority to rewrite the electoral map, legislators essentially have the power to choose their voters — to create districts in any shape or size that will weaken their opponents and increase their dominance.

In this lesson, we help students uncover the mathematics behind these biased electoral maps. And, we help them apply their mathematical knowledge to identify and address the problem.

In fact, the questions students will work through are similar to those the Supreme Court is now considering on whether gerrymandering can ever be declared unconstitutional.

The article was co-authored with Michael Gonchar of the NYT Learning Network, and is freely available here.

Related Posts


Ceilings of Curvature

On a visit to the Lowline, I noticed an interesting application of mathematics above us.

The ceiling is a tiling of hexagons and equilateral triangles.  But unlike a typical tiling of a flat bathroom floor, this tiling seems to create a curved surface!  Here’s a closer look:

The underlying pattern is hexagonal, but when a hexagon is replaced with six small, hinged equilateral triangles, the surface gains the potential to curve.

It’s interesting to follow the “straight” line paths as they curve over the surface.  And since this tiling is suspended from above, it’s interesting to think about what the surface would look like if it were lying on the ground.  How “flat” would it be?  Or a better question might be “How far from flat is it?”

SIAM ED16

siam-ed16I’m excited to be heading to Philadelphia this weekend for the SIAM Conference on Applied Mathematics Education (SIAM ED16).

I’ll be presenting on the work I do with mathematical simulation in Scratch, and I’m really looking forward to the variety of talks on bringing applied mathematics and computing into classrooms.  In particular, I’m excited to hear Maria Hernandez from NCSSM talk about how to teach modeling and Gil Strang from MIT talk about the teaching of Linear Algebra.

You can learn more at the conference website, and see the full conference schedule here.

Related Posts


Follow

Get every new post delivered to your Inbox

Join other followers: