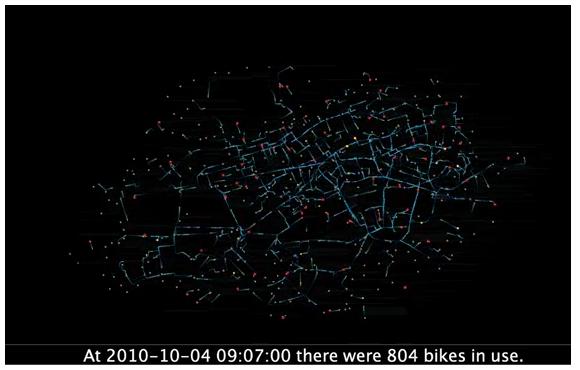
Bike Data Visualization

This is a cool visualization of bicycle usage in London:

http://www.digitalurban.org/2011/02/london-cycle-flows-sociable-physics.html

On October 4th, 2010, there was a public transit strike in London, which maximized bike usage in the city.

The creators claim that the flashes of light that represent the bikes move in accordance with the actual speed and path of the bikes they represent.

An innovative representation that puts me in mind of graph theory and networking!

Math Quiz: NYT Learning Network

Through Math for America, I am part of an on-going collaboration with the New York Times Learning Network.  My latest contribution, a Test Yourself quiz-question, can be found here:

https://learning.blogs.nytimes.com/2011/10/03/test-yourself-math-oct-3-2011/

This question is based on Facebook’s claim that they have 800 million users, and asks “What percentage of the world’s population uses Facebook every day?”

Follow

Get every new post delivered to your Inbox

Join other followers: