Dodecahedron Calendar

Here’s a fun use for a dodecahedron:  folding it up to make a yearly calendar!

https://texample.net/tikz/examples/foldable-dodecahedron-with-calendar/

Just download the PDF, print, cut, fold, and glue!  Access to a large-scale plotter might be nice, as the 8.5 x 11 version folds into something that’s pretty small.

It’s too bad there aren’t eight days in a week, otherwise we could put the octahedron to use, too!

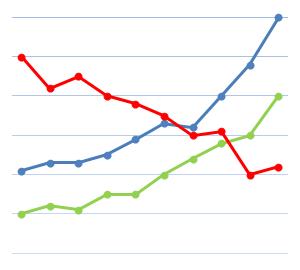
Math Lesson: Analyzing Economic Measures in a Downturn

My latest contribution to the New York Times Learning Network is a math lesson built around gathering, representing, and analyzing economic indicator data.

https://learning.blogs.nytimes.com/2011/09/28/nowhere-to-go-but-up-analyzing-economic-measures-in-a-downturn/

By getting data on Real G.D.P., personal income, corporate profits, and unemployment from official sources like the Bureau of Economic Analysis and the U.S. Department of Labor, students explore positive and negative correlations between the various economic indicators.

In addition, students can explore the relationships between graphs of quantities and their rates of change by creating and comparing graphs of percent change.

Applications of Government Data

This is a nice resource from The Guardian that highlights some of the ways developers are making government data accessible to citizens.

http://goo.gl/00jmo

The projects include housing price analysis, roadway usage, government spending, and aggregation of community information.

The site wheredoesmymoneygo.org is especially interesting:  slide the bar to your yearly income, and see just how much of your salary is spent on education, health services, defense, and other categories.

Lots of applications to play around with, and plenty of food for thought!

Follow

Get every new post delivered to your Inbox

Join other followers: