Bike Data Visualization
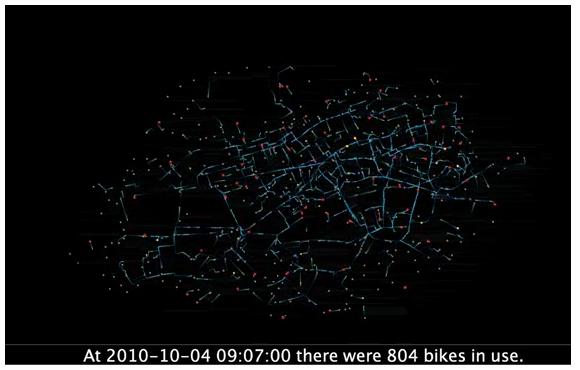
 This is a cool visualization of bicycle usage in London:
http://www.digitalurban.org/2011/02/london-cycle-flows-sociable-physics.html
On October 4th, 2010, there was a public transit strike in London, which maximized bike usage in the city.
The creators claim that the flashes of light that represent the bikes move in accordance with the actual speed and path of the bikes they represent.
An innovative representation that puts me in mind of graph theory and networking!
1 Comment
Henry Ricardon · October 6, 2011 at 9:42 am
If you connect the dots, you get a portrait of Winston Churchill…or Darth Vader…or John Cleese.