Analysis of NBA Finances

This is a comprehensive and insightful look into the NBA’s claims of financial distress from Nate Silver:

https://fivethirtyeight.blogs.nytimes.com/2011/07/05/calling-foul-on-n-b-a-s-claims-of-financial-distress/

As the NBA prepares to battle the player’s union over revenue, the league has made several public claims about how they have been losing money for years.

Silver takes a deep look into those claims.  He crunches the numbers and compares player revenue as a share of league revenue across the four major sports leagues; he looks at salary growth relative to league growth; and he also discusses some of the dubious accounting tricks teams and leagues use to make profits disappear!

As usual from Nate Silver, this is a very interesting and readable application of mathematics and statistics.  His conclusion is summed up best by a recent message from @fivethirtyeight on Twitter:  “If David Stern really thinks the NBA lost $370 million last season, shouldn’t he have fired himself?”

NBA Franchise Values

amare stoudemireEvery year, Forbes Magazine rates the value of all the franchises in the NBA.   Here is the complete list:

http://www.forbes.com/lists/2011/32/basketball-valuations-11_rank.html

Surprisingly, the New York Knicks are now the most valuable team in basketball, topping the list at $655 million.  Their 12% increase in value since last year certainly has something to do with the impact of Amar’e Stoudemire, who has raised both the team’s competitiveness and marketability.  The fact that the Knicks carry no debt probably plays a part in their high valuation as well.

It appears as though the Knicks’ signing of Stoudemire last year to a 5-year, $100 million contract was a good move after all, despite my strong belief that it was a mistake.

It’s no surprise that LeBron James’ decision had serious financial ramifcations for both teams involved.  The value of the Miami Heat rose 17% to $425 million.  That’s an increase of nearly $60 million.  The value of the Cleveland Cavaliers dropped 26% to $355 million, a decrease of nearly $130 million.

One might wonder where that extra $70 million in value went!

Efficient Ticket Hypothesis

ticketsIn a past post, I wondered how a local museum theater could make money showing movies to limited audiences.  Well, here is a step in wrong direction, business-wise, anyway:  the $0.00 ticket.

All kidding aside, Free Fridays are a great way to get people into the museums, and it’s probably pretty good for business overall.  The MoMA was packed with people, and the gift shop–and it’s $40 photobooks and $23 T-shirts–was equally occupied.  An interesting question is then “How much does the museum make on each $0.00 ticket?”

An uninteresting question is “why didn’t the security guard just let me in without a ticket, instead of demanding that I go grab two from a big pile on the front desk and then not collect the tickets from me anyway?”

It was enough to make me consider asking for my money back.

Baseball Bailouts

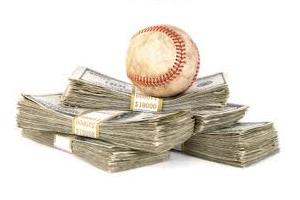
Baseball MoneyThere’s an interesting article in the NYT about the economics of baseball’s revenue-sharing system.

The revenue-sharing system is essentially a robin-hood style redistribution of baseball income, taking money from the most profitable teams and dividing it up among the least profitable.   The system, in theory, gives smaller-market teams a chance to compete with their big-market brethren by providing them with addtional cash to invest on players.  But are the recipients of these baseball bailouts really using the money to improve their teams?  Thanks to an anonymous leak last summer, the public was given an unprecedented look at some MLB financial information.

It was quite interesting to see that the Pittsburgh Pirates, who not only have posted a league-record 18 consecutive losing seasons but also rank near the bottom of the MLB in both popularity and team payroll, have actually been quite profitable the past few years.  For example, in 2007 and 2008 the Pirates, who routinely traded away their best players, not only made around $30 million in profit but also collected around $70 million in revenue sharing payouts!

Maybe the owners of the Pirates have figured out that spending their yearly $35 million bonus on players doesn’t increase revenue enough to make it worthwhile.  Why not just take the safe money?  Not a bad year for a business that hasn’t seen success in two decades.

Are Stock Prices Random? Part II

Last week, I challenged readers to identify which graph was the stock market and which graph was random.  The purpose of the exercise was to highlight a fundamental question  in economics and finance–are the valuations of things (like stocks and equities) predictable, or are they essentially random?  Can you beat the market, or is it all just a crap-shoot?

I predicted that it would be hard for people to tell the stock prices from the random prices, thereby suggesting that stock prices are random.   I don’t claim that the exercise was rigorous or exhaustive, but the results seem to agree with my prediction:  54% thought Graph A was the stock market, and 46% though Graph B was the stock market.  Whichever is the correct answer, it doesn’t appear obvious.

Some people noted that the variations of the two graphs make it easy to tell which was which.  Highlighted below, we see that Graph A has more places where the graph jumps or drops quickly; mathematically, this would be measured as variation.  But is this an indication of randomness or reality?

Stock Graphs

What I found most interesting about the process was how challenging it was to make a sequence of numbers that were essentially “random” but looked like the stock market.  It was harder than I thought, and the few people who knew how I did it seemed to have an easier time picking the correct graph.

Stay tuned for more graph-picking!

Related Posts


Follow

Get every new post delivered to your Inbox

Join other followers: