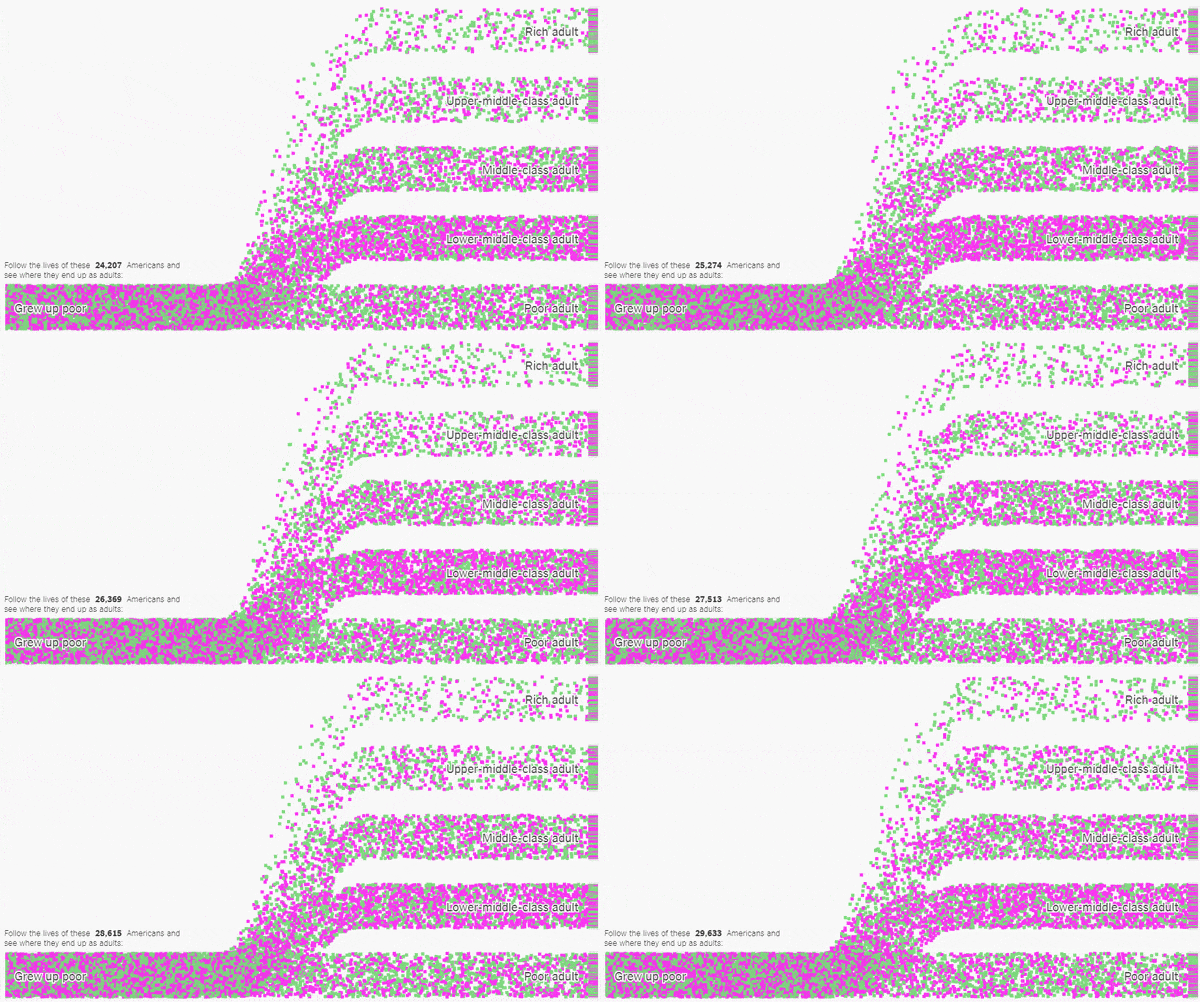
My latest piece for the New York Times Learning Network was inspired by some amazing data visualizations from The Upshot.
These animations show trends in economic mobility gathered from a landmark study of 20 million Americans. In my lesson, students use the Upshot’s customizable tools to collect and analyze data from the study to determine which groups of Americans have the best chance of improving their economic standing.
Here’s the introduction:
America is often referred to as the land of opportunity. But are all opportunities created equal? Do all Americans have the same chance of achieving the American dream?
A groundbreaking study of United States census data examined how the economic status of 20 million Americans changed from childhood to adulthood, and while the data has a lot to tell us about economic opportunity in the United States, it is likely to raise more questions than it answers.
In this lesson, students use tools created by The New York Times to explore data from the study on economic mobility. They will analyze and categorize economic outcomes, compare and contrast statistics for different demographic groups, and pose and explore their own questions about what this data has to say about economic opportunity.
Does everyone in America have the same chance at success? Let’s see what the data says.
The full lesson is freely available here.

 My latest piece for the New York Times Learning Network is a math lesson exploring personal savings and the power of compound interest. The piece was inspired by a new program in Illinois that creates an automatic payroll-deduction savings program for all state residents.

