Are Stock Prices Random?
A lot of people spend a lot of time trying to understand stock prices: Are they predictable? Are they random? Can you make money by identifying trends? Can you beat the market and make a fortune?
A prevailing theory is that stock prices are essentially random walks; that is, no more predictable than a coin flip. The amount a price goes up or down at any given moment might follow some pattern (small movement is more likely than large movement, for example), but whether that movement is up or down is basically random. Now, what random means to mathematicians can get kind of complicated, but that’s another story.
I thought it might be interesting to compare actual stock prices to a randomly-generated trend line. After playing around with a spreadsheet and experimenting with different parameters, I produced the following two graphs:
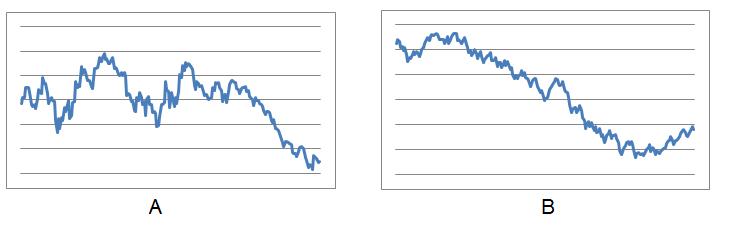
One of these graphs represents 200 days of prices of the Dow Jones Industrial average; the other represents a quantity that moves up or down randomly, by some random amount. Figuring out how to get a good-looking random graph took some time, and is an interesting challenge in and of itself.
So, can you tell which is the Dow and which is a coin toss? More importantly, how much would you be willing to bet on it?
Related Posts
2 Comments
Sean · September 28, 2010 at 8:51 pm
You’d be surprised at how often the gambler’s fallacy (the idea of randomness having memory) is applied to predicting the stock market. It’s exactly the same flaw in believing a coin must land on heads next if it has landed on tails several times in a row. However, at least in coin tosses, there’s a slight chance the coin may be weighted if it continues to land on one side, so that may have some merit…
Alan · October 2, 2010 at 5:28 pm
“No solution.” I guess.
A can be seen as a coin toss where the heads and tails switch randomly. It can also be seen as Dow, since the stocks rise and fall in the same fashion.
B can represent a “weighted” coin that’s landing on heads or tails repeatedly. It can also be seen as Dow with a very bad day.
Wait a minute, how would A and B show coin toss? It’s either Heads or Tails, unless you show how that total amount changes over time.