Are Stock Prices Random? Part II
Last week, I challenged readers to identify which graph was the stock market and which graph was random. The purpose of the exercise was to highlight a fundamental question in economics and finance–are the valuations of things (like stocks and equities) predictable, or are they essentially random? Can you beat the market, or is it all just a crap-shoot?
I predicted that it would be hard for people to tell the stock prices from the random prices, thereby suggesting that stock prices are random. I don’t claim that the exercise was rigorous or exhaustive, but the results seem to agree with my prediction: 54% thought Graph A was the stock market, and 46% though Graph B was the stock market. Whichever is the correct answer, it doesn’t appear obvious.
Some people noted that the variations of the two graphs make it easy to tell which was which. Highlighted below, we see that Graph A has more places where the graph jumps or drops quickly; mathematically, this would be measured as variation. But is this an indication of randomness or reality?
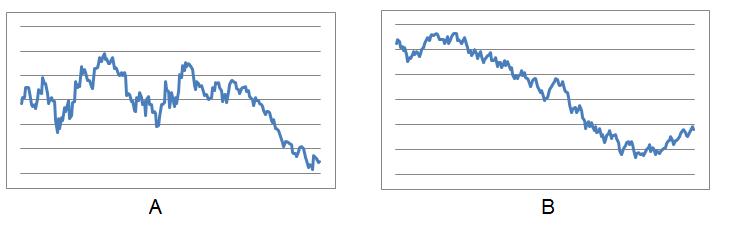
What I found most interesting about the process was how challenging it was to make a sequence of numbers that were essentially “random” but looked like the stock market. It was harder than I thought, and the few people who knew how I did it seemed to have an easier time picking the correct graph.
Stay tuned for more graph-picking!
Related Posts
0 Comments