Are Stock Prices Random?

A lot of people spend a lot of time trying to understand stock prices:  Are they predictable?  Are they random?  Can you make money by identifying trends?  Can you beat the market and make a fortune?

A prevailing theory is that stock prices are essentially random walks; that is, no more predictable than a coin flip.  The amount a price goes up or down at any given moment might follow some pattern (small movement is more likely than large movement, for example), but whether that movement is up or down is basically random.  Now, what random means to mathematicians can get kind of complicated, but that’s another story.

I thought it might be interesting to compare actual stock prices to a randomly-generated trend line.  After playing around with a spreadsheet and experimenting with different parameters, I produced the following two graphs:

Stock Graphs

One of these graphs represents 200 days of prices of the Dow Jones Industrial average; the other represents a quantity that moves up or down randomly, by some random amount.  Figuring out how to get a good-looking random graph took some time, and is an interesting challenge in and of itself.

So, can you tell which is the Dow and which is a coin toss?  More importantly, how much would you be willing to bet on it?

Related Posts


An Impossible Construction

I enjoy offering impossible problems to students as extra credit, although I usually don’t tell them the problems are impossible.  Such tasks usually engage them, confuse them, and make them suspicious of me.  It’s a win-win-win.

While discussing some three-dimensional geometry, I offered extra credit to anyone who could build a model of a Klein bottle.  The Klein bottle is a hard-to-imagine surface that has neither an inside nor an outside.  It’s like a tube where one end meets the other and makes a seal, but somehow got turned inside out in the process.  If you are familiar with the Mobius strip, the Klein bottle is basically a higher-dimensional Mobius strip.

One reason that the Klein bottle is hard to visualize is that it can’t be observed in three dimensions:  it needs a fourth dimension in order to see it turn itself inside-out.  This is analogous to the standard construction of the Mobius strip:  we take a long strip of paper, give one end a half-twist, and tape the ends together.  We think of the paper itself as being 2-dimensional, but we need that third dimension to twist through.

So, I was pretty impressed with the student who made this.

Klein Bottle
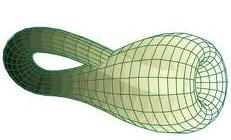
Not bad at all, for someone who is dimensionally challenged.  Here’s a nice representation for comparison, although it’s still a cheat.  The Klein bottle doesn’t really intersect itself.

Klein bottle graph

A nice example of impossibly creative student work!

Football Inequality

The 2010 NFL season is off to a mathematically interesting start.

The Jets, Patriots, Bengals, and Ravens each have played two games against other teams in that group of four.  The results can be organized like this (for example, the Bengals lost to the Patriots but beat the Ravens)

AFC East InequalityNow, if we interpret “wins the game” to mean something like “is better than”, and if we believe that “is better than” is a transitive relationship (i.e. “If A is better than B and B is better than C, then A is better than C”), then the Jets are better than every team in their division, including themselves!  Some might prefer to say that they are even worse than themselves.

It’s not easy producing mathematically consistent ranking systems, but it’s an interesting and useful problem, and the field is quite rich.

Cold Oceans and Newton’s Law of Cooling

feet in oceanWhen in Maine, I thought it would be fun to go swimming in the ocean.  I’d driven all that way, right?  I knew it would be cold when I noticed that of the 200 or so people at the beach, only 5 were actually in the water, and only one of them was in past their knees.  And he was Canadian.

After I swam for a few minutes, lost much sensation in most of my body, and stumbled back to the beach feeling slightly burned all over, I asked around and discovered that the water temperature was around 55 degrees Fahrenheit.  Which made me wonder, “How long could I have swim in such water before suffering severe consequences?”

Normal body temperature is around 98.6 degrees.  Hypothermia sets in when one’s body temperature falls to 95 degrees, and apparently things seem to get very bad at around 92 degrees.  Now, Newton’s Law of Cooling states that the rate of change of the temperature of an object is proportional to the difference between the temperature of that object (in this case, my body) and the ambient temperature (the 55-degree ocean).  The difference in those two temps–about 34 degrees–seems [relatively] high, so I imagine that my body would cool pretty rapidly to the danger zone.

I was very excited to calculate how much time I theoretically had, but unfortunately I didn’t know how to determine the value of the constant in the Newton’s equation.  Can anyone suggest an appropriate value of k? It probably depends on properties of salt-water and the human body.  I asked the lifeguard, but he didn’t know.

Math Quiz: NYT Learning Network

Through Math for America, I am part of an on-going collaboration with the New York Times Learning Network.  My latest contribution, a Test Yourself quiz-question, can be found here:

http://learning.blogs.nytimes.com/2010/09/15/test-yourself-mathseptember-15-2010/

This question was based on a recent study regarding New York’s trains, how often they run on time, and how that measures up with the perception that they run on time; click here to read more.

Follow

Get every new post delivered to your Inbox

Join other followers: