Paddling Upstream

canoeThe Canoe in the River problem is an algebra classic.  You know how it goes:  “Paddling upstream, it takes Betty Boater 6 hours to travel up the river to Point Apex.  It takes only 3 hours for the return trip downstream to Point Bellows.  If the distance between Point A. and Point B. is 15 miles, what would Betty Boater’s speed be in still water?” 

Below is wonderful retelling of the Canoe in the River problem created by Dan Meyer.  Using a video camera, an ipod, a quiet morning in a mall, and some great editing, this problem is brought new life in this modern and engaging context.

dmeyer -- boat in river

Check it out at http://blog.mrmeyer.com/?p=7649.  Meyer seems to be focused on modernizing mathematics curricula, and the more stuff he does like this, the better.

And for Betty Boater’s speed, click here.

Are Stock Prices Random? Part II

Last week, I challenged readers to identify which graph was the stock market and which graph was random.  The purpose of the exercise was to highlight a fundamental question  in economics and finance–are the valuations of things (like stocks and equities) predictable, or are they essentially random?  Can you beat the market, or is it all just a crap-shoot?

I predicted that it would be hard for people to tell the stock prices from the random prices, thereby suggesting that stock prices are random.   I don’t claim that the exercise was rigorous or exhaustive, but the results seem to agree with my prediction:  54% thought Graph A was the stock market, and 46% though Graph B was the stock market.  Whichever is the correct answer, it doesn’t appear obvious.

Some people noted that the variations of the two graphs make it easy to tell which was which.  Highlighted below, we see that Graph A has more places where the graph jumps or drops quickly; mathematically, this would be measured as variation.  But is this an indication of randomness or reality?

Stock Graphs

What I found most interesting about the process was how challenging it was to make a sequence of numbers that were essentially “random” but looked like the stock market.  It was harder than I thought, and the few people who knew how I did it seemed to have an easier time picking the correct graph.

Stay tuned for more graph-picking!

Related Posts


Are You Related to Confucius?

Are all of us descendants of Confucius?  Here’s a curious mathematical argument that suggests just that.

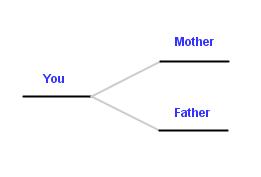
No matter who you are, you came from a mother and a father (I won’t go into details).  So, in your family tree, the part behind you has two branches, like this:

family tree 1

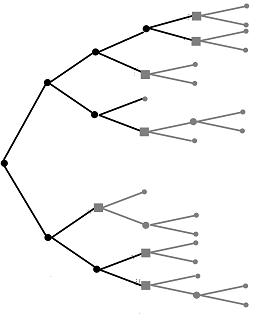
The same goes for your mother and father, and their mothers and fathers, and so on.  Thus, continuing on back the line, you see a family tree like this

binary tree

And it just keeps going and going and going.  An interesting mathematical feature of this tree is that, as your move backward in time, each generation has twice as many branches as the previous generation, roughly speaking.  Thus, when you go back a hundred or so generations, to the time of Confucius, the number of branches in your family tree is roughly 2^{99}, or 633,825,300,114,114,700,748,351,602,688 (thanks, WolframAlpha).

A reasonable estimate is that at the time of Confucius there were around 250 million total people in existence.  Each of those 2^{99} spots in your family tree has to be filled by someone, which means that, on average, each person in existence at that time had to fill roughly

\frac {2^{99}} {250,000,000} =  2,535,301,200,456,458,802,993

of the spots in your family tree.   It seems like a statistical impossibility that Confucius wasn’t one of them.  So, I guess that makes us cousins?

Follow

Get every new post delivered to your Inbox

Join other followers: