NYT Presents: Jeterography
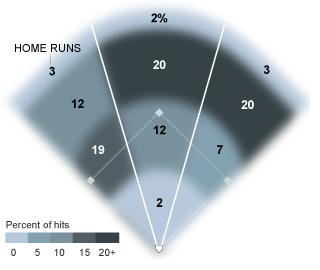 In celebration of Derek Jeter’s 3,000th major league hit, the New York Times ran a really cool infographic displaying the relative frequencies of where those 3,000 hits went.
In addition to tracking where all of Jeter’s hits have gone, two graphics also compare his first 1,500 hits to his second 1,500 hits: not surprisingly, the second 1,500 consists of fewer home runs and fewer hits to left field. A similar graphic shows Alex Rodriguez’s hit patterns.
There are several other interesting data displays here, including year-by-year histograms for all 28 MLB players with 3,000 hits.
0 Comments