Ode to Equilateralism

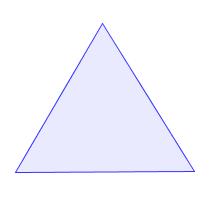
Equilateral 1Today, 10/10/10, is Equilateral Triangle Day!  This day doesn’t come around that often, so I thought I’d expound a bit on the virtues of equilateralism.

There is so much to appreciate about the equilateral triangle–its uniform shape, its simple area formula, its presence in regular hexagons, its decomposition into 30-60-90 triangles–and most of these properties are a consequence of the equilateral triangle’s abundance of symmtery.

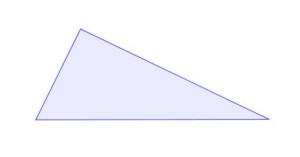
Consider this plain old non-equilateral triangle.

plain triangle

In any triangle, from any vertex there are three important segments you can draw–the angle bisector, the altitude, and the median.  Each of the segments defines a kind of symmetry for that part of the triangle.

Triangles

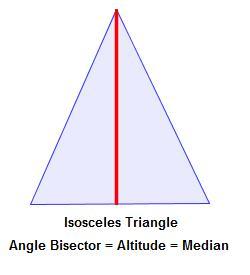
Notice how these three segments are all quite different in our plain old non-equilateral triangle.  But, if we were to make the two sides from that vertex the same length (i.e., make the triangle isosceles), all those segments become equal!

Isosceles Triangle

The sides being the same length force all those lines of symmetry to become one.  Now, the beauty of the equilateral triangle is that it’s like three isosceles triangles rolled into one! 

Equilateral 2

It’s an isosceles triangle from every vertex!  So, all those lines of symmetry are the same no matter how you look at it.

Enjoy the next 397 days, until the next Equilateral Triangle Day.

Related Posts


Look Around You — Maths

funjy's mathsThis is a thoughtful and hilarious satire of old-school, British public television-style educational videos.

http://www.youtube.com/watch?v=Pj2NOTanzWI

I laughed repeatedly throughout.  Watch the video, and give it a minute or so to win to you over.  It’s worth it.

P.S.  Students–please do not bring razor blades, Garry Gum, or Anti-Garry Gum to class in your pencil case.

Thanks to Ivan R. for showing me this! 

What’s So Special About 733?

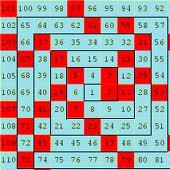
number spiralThis is a nice resource from Erich Friedman, a math professor at Stetson University:  it’s a list of distinctive characteristics of [most of] the numbers between 1 and 9999:

http://www2.stetson.edu/~efriedma/numbers.html

Now, maybe knowing that 215 is equivalent to 555 in base 6 isn’t that useful, but there are a lot of great ideas woven throughout this list of integers.  If you can fill in any of the gaps (do you know anything distinctive about 6821?), I’m sure Dr. Friedman would love to hear from you.

I, RuBot

RuBotThis is a great video of RuBot, the Rubik’s cube solving robot!

http://www.youtube.com/watch?v=pOhU3WP7zXw

This video was shot at the Maker Faire, a sort of do-it-yourself science fair recently held in NYC.

Apparently you can scramble up the cube any way you like, and set it on RuBot’s platform.  RuBot picks it up, inspects the sides to determine the configuration, and then solves the cube!  RuBot must have been happy when it was recently announced that every position of the Rubik’s cube can be solved in 20 moves or less.

I’m not sure if Rubot can solve 4×4’s or 5×5’s cubes.  And I’m not sure why they made him look so creepy.

Are Stock Prices Random? Part II

Last week, I challenged readers to identify which graph was the stock market and which graph was random.  The purpose of the exercise was to highlight a fundamental question  in economics and finance–are the valuations of things (like stocks and equities) predictable, or are they essentially random?  Can you beat the market, or is it all just a crap-shoot?

I predicted that it would be hard for people to tell the stock prices from the random prices, thereby suggesting that stock prices are random.   I don’t claim that the exercise was rigorous or exhaustive, but the results seem to agree with my prediction:  54% thought Graph A was the stock market, and 46% though Graph B was the stock market.  Whichever is the correct answer, it doesn’t appear obvious.

Some people noted that the variations of the two graphs make it easy to tell which was which.  Highlighted below, we see that Graph A has more places where the graph jumps or drops quickly; mathematically, this would be measured as variation.  But is this an indication of randomness or reality?

Stock Graphs

What I found most interesting about the process was how challenging it was to make a sequence of numbers that were essentially “random” but looked like the stock market.  It was harder than I thought, and the few people who knew how I did it seemed to have an easier time picking the correct graph.

Stay tuned for more graph-picking!

Related Posts


Follow

Get every new post delivered to your Inbox

Join other followers: