Demonstration of Linear Independence

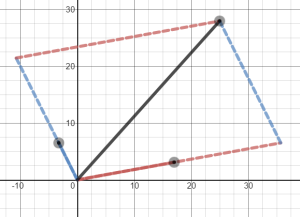
vectors spanning the plane

I’ve put together a simple Desmos interactive that demonstrates the basic ideas of linear independence.

If two plane vectors are linearly independent, then every vector in the plane can be written as a linear combination of those two vectors.  Those two vectors span the plane.

By playing around with the sliders in this interactive, you can see how every vector in the plane can be expressed as a linear combination of the two original vectors.

Moreover, if you make the two original vectors parallel, they no longer span the plane.  That’s because the two original vectors are now linearly dependent!  Each is a linear combination (in this case, a scalar multiple) of the other.

You can see this Desmos interactive here, and you can find more of my Desmos-based demonstrations here.
3D Printing in Calculus Class

I’m looking forward to exploring 3D printing in Calculus class this year.  We don’t have a printer in our classroom (yet!), but some students have enough experience and access to work on modest projects outside of class.

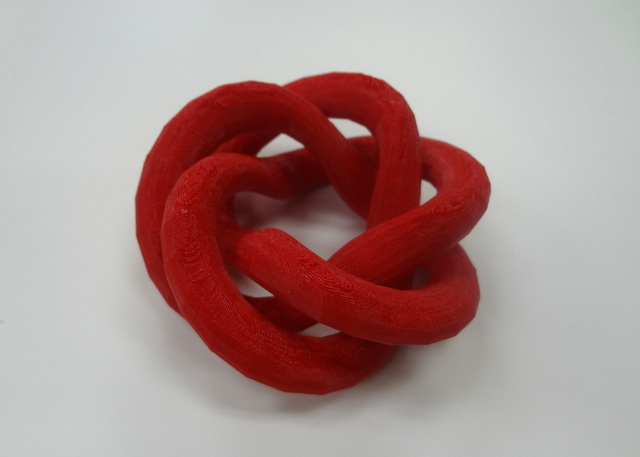
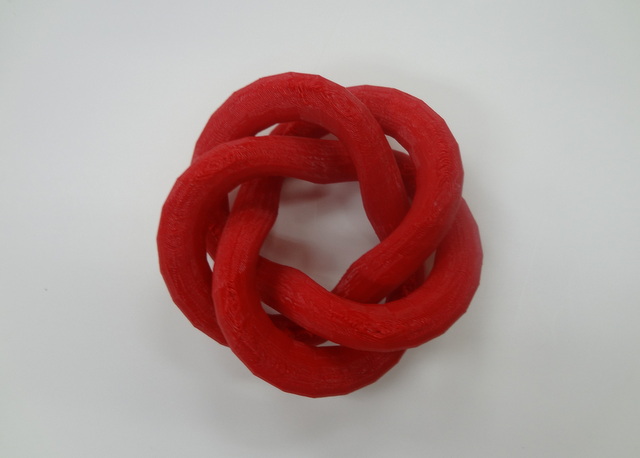
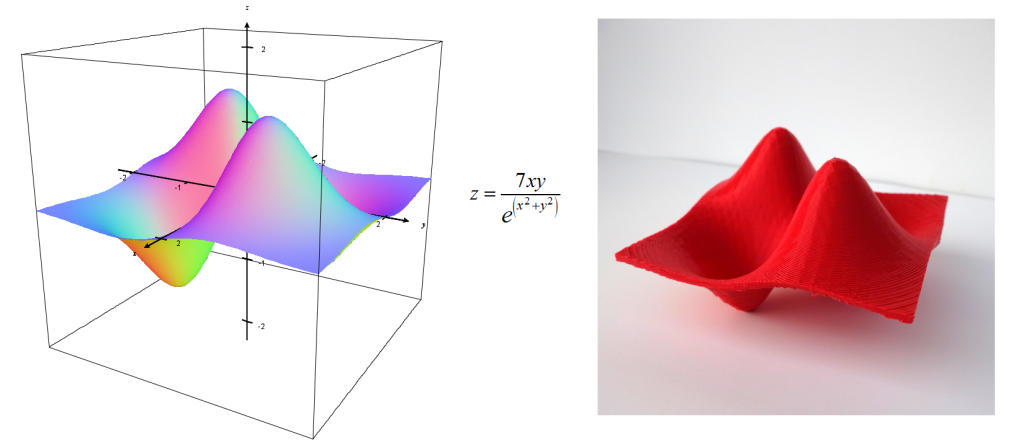
Here’s a print of an interesting surface in xyz-coordinate space.

Beautiful Surface and Printed SurfaceIt’s always exciting to find a new way to represent or experience a mathematical idea, and physical representations can be especially powerful.

And perhaps more importantly, 3D printing gives students an opportunity to use mathematics to create.  Mathematics is a creative endeavor, and whatever helps promote this idea will ultimately help change attitudes about math.


Exploring Correlation and Regression in Desmos

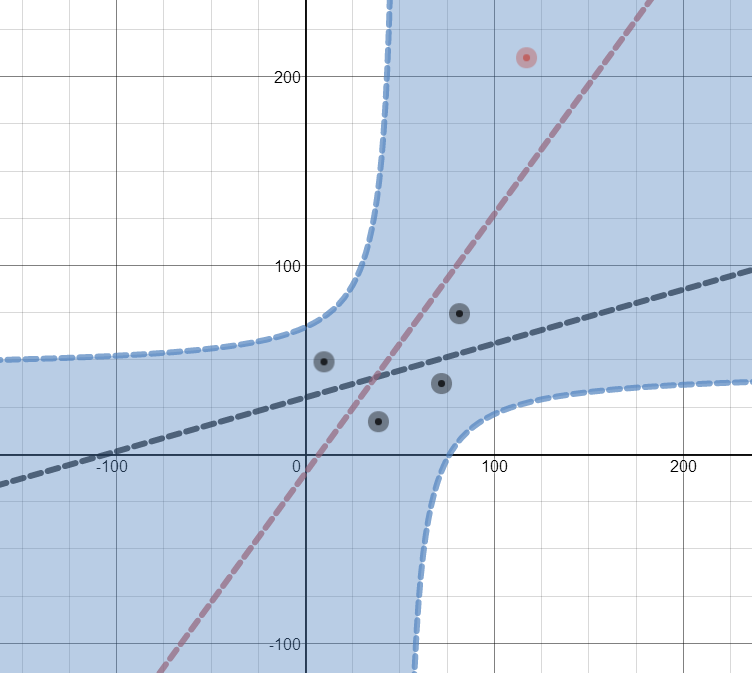
exploring correlationI’ve created an interactive worksheet in Desmos for exploring some basic ideas in correlation and regression.

In the demonstration, four points and their regression line are given.  A fifth point, in red, can be moved around, and changes in the regression line and correlation coefficient can be observed.

The shaded region indicates where the fifth point can be located in order to make (or keep) the correlation among the five points positive.  The boundary of that region was a bit of a surprise to me!

You can access the worksheet here.  Many interesting questions came to mind as I built and played around with this, so perhaps this may be of value to others.  Feel free to use and share!

You can find more of my Desmos-based demonstrations here.
When Desmos Fails

I am huge fan of Desmos, the free online graphing calculator.  I use it almost every day in my classroom:  to sketch simple graphs, demonstrate mathematical relationships, and dynamically explore mathematical situations.  And like most worthy instructional technologies, it’s really a learning technology:  it’s easily accessible to students as well as teachers..

As far as technology goes, Desmos works very well.  But some of my favorite mathematical questions arise when technology does something we don’t expect.

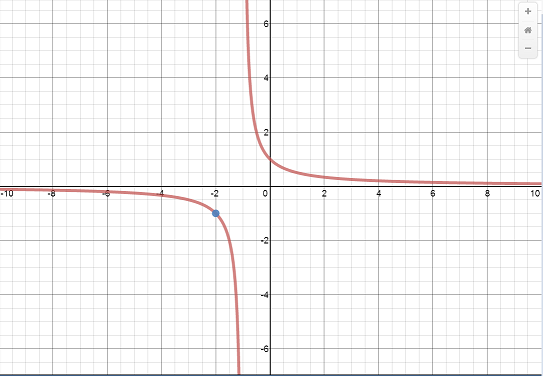
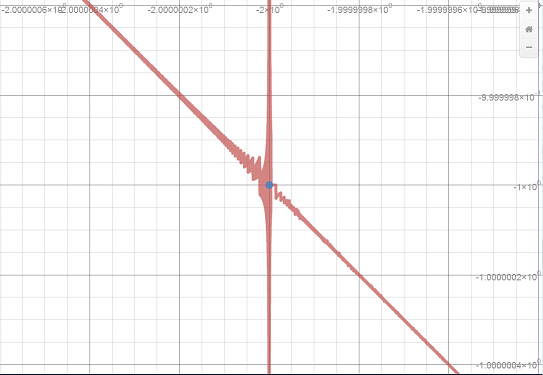
For example, here’s the graph of f(x)=\frac{x+2}{x^2+3x+2}.  This graph has a hole (a removable discontinuity) at the point (-2,-1), which I have colored blue.

Desmos -- Zoomed Out

But look what happens when you zoom in around the hole:

Desmos -- Zoomed In

At a very small scale, some very curious behavior emerges!

Now, it’s not the function here that’s behaving strangely:  its behavior is well-understood.  It’s the mathematical technology that is behaving strangely, as it tries to represent the function.

Lots of interesting questions emerge from such anomalies, and these are great questions for students to explore.  In doing so, they’ll not only learn some mathematics and some computer science, but they’ll also develop a healthier relationship with technology, by learning to understand how it does what it does, and perhaps more importantly, what it doesn’t do.  I explore this theme in greater depth in my talk “When Technology Fails“.

You can find more of my work with Desmos here.

Related Posts


Follow

Get every new post delivered to your Inbox

Join other followers: