Exploring Correlation and Regression in Desmos
 I’ve created an interactive worksheet in Desmos for exploring some basic ideas in correlation and regression.
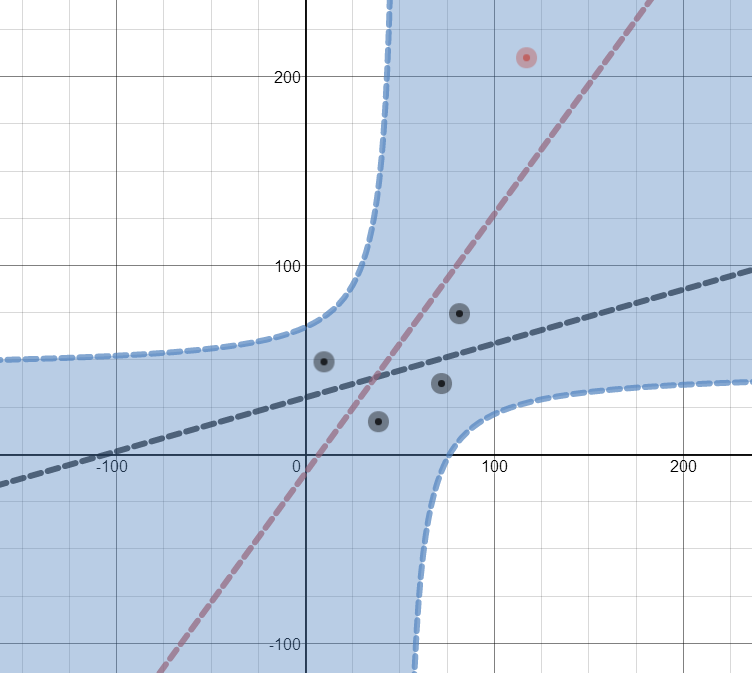
In the demonstration, four points and their regression line are given. A fifth point, in red, can be moved around, and changes in the regression line and correlation coefficient can be observed.
The shaded region indicates where the fifth point can be located in order to make (or keep) the correlation among the five points positive. The boundary of that region was a bit of a surprise to me!
You can access the worksheet here. Many interesting questions came to mind as I built and played around with this, so perhaps this may be of value to others. Feel free to use and share!
You can find more of my Desmos-based demonstrations here.
0 Comments