Visualizing Cantor’s Zig Zag

A famous and intriguing result in mathematics is that there are just as many points on a line as there are in a plane. This seems counterintuitive at first: planes contain infinitely many lines, so not only should a plane have infinitely many more points than a line, it should have infinitely times as many points as a line! But this is one of the many curious consequences of the mathematics of infinity.

Here, we’ll restrict ourselves to points in the plane with non-negative integer coordinates. Think about points of the form ( c), where c is a non-negative integer. Since there are infinitely many integers, this set of points is infinite, and the points all lie on the line y = 0. The set of points of the form ( c, ) is also infinite, and these points all lie on the line = 1. Notice that, since these two lines are parallel, every point on one matches up perfectly with a point on the other: (0,0) with (0,1); (1,0) with (1,1); (2,0) with (2,1), and so on.

This matching offers a reasonable argument that the two sets have the same number of points: Every point in each set has a unique partner in the other, so counting the points in one is equivalent to counting the points in the other. In this case, we say that the two sets are in one-to-one correspondence. And if anything, this only seems to bolster the argument that there are more points in the plane than on a line: There are infinitely many lines of the form y = k in the plane, and each one contains as many points as the line = 0. So the plane should contain infinitely times as many points as the line! But the mathematics of infinity is tricky business.

Even though it seems like there are far more points in the plane than on the line, it’s possible to match the two sets up in a one-to-one correspondence. It’s not obvious how to do that, but thanks to Georg Cantor and his famous zig zag, we know it can be done. Here’s a visualization I created in Desmos to demonstrate this matching.

This animation shows how each point in the quarter-plane can be paired up with exactly one point on the half-line, and vice versa. The zig-zag pattern enumerates the points in the plane, showing that they could be rightly imagined as though all lying in order on a straight line. This one-to-one correspondence shows that the sets are the same size. And while this demonstration is limited to only part of the plane, the argument can be extended: for example, skipping every other point on the line y = 0 would create space to accommodate the points with negative y-coordinates.

The animation above is an extension of an earlier version shared on Twitter.

Thanks to Chris Long (@octonion) for inspiring this journey into the infinite by linking to this great paper on Cantor packing polynomials, which I used to create the above Desmos demonstrations. And Kelsey Houston-Edwards also recently shared a fun and related problem. I guess infinity is in the air!

Related Posts


NCTM Annual — 2018

I’m excited to be heading to Washington, DC in April for the 2018 NCTM Annual Meeting!

NCTM’s annual meeting brings together thousands of educators from across the country to discuss mathematics, pedagogy, technology, and more. I presented at the 2017 Annual Meeting in San Antonio and had a great time, so I’m looking forward to this year in DC.

I’ll be presenting Statistics and Simulation in Scratch, a 60-minute session about using simple computer programming tools to make the study of probability and statistics more experimental and exploratory. We’ll look at ways teachers and students can use Scratch, the free, web-based programming environment designed by the MIT Media Lab, to model simple probability experiments, collect and analyze data, and create mathematically compelling projects. The technology tools we’ll be using are free and intuitive, and they open up a new pathway to probability and statistics for students and teachers. In addition, it creates opportunities to learn and apply fundamental computer programming skills in a meaningful context.

My talk is scheduled for Thursday, 4/26/18, at 3:00 pm, so if you’re planning on attending the NCTM Annual, please keep my session in mind!

Conferences like this are great opportunities for professional growth, but the logistics are often complicated for classroom teachers.  I’m fortunate to have received support from Math for America, which makes attending NCTM’s Annual Meeting in Washington DC possible. And I’m proud to be one of several MfA teachers presenting at NCTM! You can find a complete list of MfA presenters here.

Related Posts


MfA Workshop — Stats and Sims in Scratch

Tonight I’ll be running a workshop, “Stats and Sims in Scratch”, for teachers at Math for America. In this workshop we will develop basic computational tools for exploring elementary and advanced problems in probability, and implement and apply statistical procedures via programming.

This workshop is a product of my ongoing efforts to integrate mathematics and computer science in my classrooms. The study of probability creates natural opportunities to bring in tools from computer science, which create alternate pathways to understanding concepts in probability through generating, managing, and analyzing data.

I will also be presenting on this topic at the NCTM Annual Meeting in Washington, DC in April of this year. Feel free to contact me for more information about this particular workshop or my other work with mathematics and Scratch.

Related Posts


Making Math with Scratch — Scratch Ed

Scratch Ed, an organization at the Harvard Graduate School of Education that supports teaching and learning with Scratch, recently profiled some of my work teaching mathematics using Scratch.

The article, Making Math with Scratch, highlights a Math for America workshop I ran for teachers that centered on approaching mathematical concepts through the lens of coding and computer science.  Several projects I use in my classroom are featured, and I also discuss why I like teaching with Scratch and how it’s become a valuable part of my approach to teaching math.

The purpose of the workshop and Patrick’s classroom activities are to demonstrate the power of bringing mathematics and computer science together. “Ultimately the goal is to show how math and computer science are great partners in problem solving. And Scratch provides a terrific platform for that.” 

I’m excited to share the work I’ve been doing with math and Scratch over the past few years–including talks and workshops at conferences like Scratch@MIT, SIAM ED, and the upcoming NCTM Annual meeting–and I really appreciate this nice profile from Scratch Ed.

You can read the full article, Making Math with Scratchat the Scratch Ed website.

Regents Recap — June 2016: Still Not a Trig Function

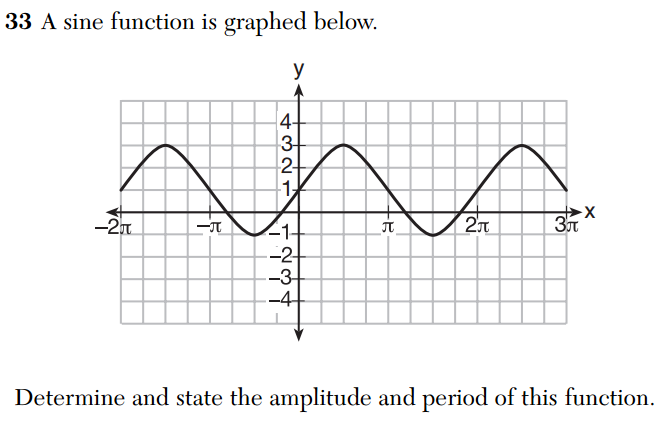
I don’t know exactly why, but fake graphs on Regents exams really offend me.  Take a look at this “sine” curve from the June, 2016 Algebra 2 Trig exam.

2016 June A2T 33

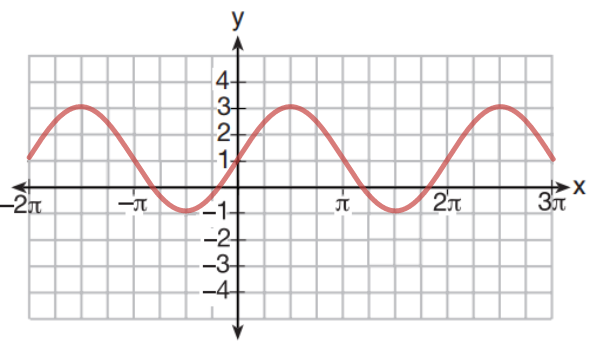
Looking at this graph makes me uneasy.  It’s just so … pointy.  Here’s an actual sine graph, courtesy of Desmos.

2016 June A2T 33 -- desmos graph

Now this fake sine curve isn’t nearly as bad as these two half-ellipses put together, but I just don’t understand why we can’t have nice graphs on these exams.  It only took me a few minutes to put this together in Desmos.  Let’s invest a little time in mathematical fidelity.

Related Posts


Follow

Get every new post delivered to your Inbox

Join other followers: