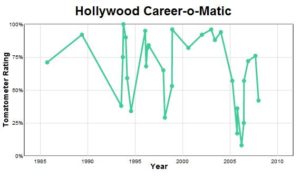
Rotten Tomato Analysis

This is a cool collection of data analysis from Slate.com that uses scores from the movie review site RottenTomatoes.com to chart the careers of actors and directors.

http://www.slate.com/id/2296070/

In addition to comparing the average career trajectories of actors and directors (a curious result!) and provoking interesting questions like “Why does the average rating seem to be falling over time?”, Slate provides a great little toy to play with:  the Hollywood Career-o-Matic.

Type the name of any actor or director into the Career-o-Matic and see a quantitative overview of that person’s film history graphed out in front of you!  You can even type multiple names and compare graphs!  Scrolls over the highs (and lows) to get film details.

A nice little data tool, and it’s easy to see some fun, informal data projects coming from this.  And it looks like it all started with this brilliant critique of M. Night Shyamalan.

Rating the Ballparks

baseball-stadium-rankingsIn an attempt to rate the various Major League Baseball stadiums around the country, Nate Silver looked at the user ratings from online review site Yelp.  Noting that every ballpark has at least several hundred user reviews, Silver compiled the data from Yelp’s 1 to 5 rating system to create an ordering of the stadiums.  Once complete, the list creates a natural starting point to investigate questions like “Is ballpark satisfaction correlated with team performance?” and “How valuable is a retractable-roof stadium?”

Silver also provides the standard deviation for the ratings for each ballpark and explains the significance.  Standard deviation is a measure of the dispersion of data, so a higher deviation means more extreme ratings.

A great, fun little project!  What else can we rate using available user ratings?

Read the full article here.

World Stats Counter

worldometersThis website provides running tallies on several world-wide statistics:

http://www.worldometers.info/

Data on Population, Energy, Economics, and Health are all constantly “updating”, brought you you by the Real Time Statistics Project.

In addition to the obvious questions one could ask, like “At what point will the world’s population grow to over 10 billion?” or “When will the earth run out of oil?”, there are interesting meta-questions like “Where do these models come from?” and “What assumptions are being made to calculate the amount of money spent on weight-loss programs?”.

Another nice resource to play around with!

Statistically Predicting the Oscars

oscarNate Silver, of 538 fame, made his name using advanced statistical modeling techniques to analyze and project political elections.  Apparently, one of his side projects is developing similar strategies for predicting Oscar winners.

http://carpetbagger.blogs.nytimes.com/2011/02/24/4-rules-to-win-your-oscar-pool/

Silver aggregates the results of other awards, intra-Oscar award correlation, anti-comedy bias , and, perhaps, a touch of gut feeling to make his predictions.

We’ll see if The King’s Speech does as well as he thinks!

2010: The Year in Facebook Statistics

facebook logoThis is a cool summary of 2010 in terms of Facebook-related statistics:

http://www.siliconrepublic.com/digital-life/item/19778-facebooks-2010-by-the-numb

With 500 million (!) users, Facebook is rapidly becoming a source of seemingly limitless data about how people live and interact in modern society.  Some of the highlights:

  • Nearly 61 million people changed their relationship status to in a relationship / engaged / married
  • Nearly 43 million people changed their relationship status to single
  • Over 6000 pages were liked every second!  (Speaking of which, how about liking my page?)

The potential applications of analysis of this data, both good and bad, are mind blowing.  As previously noted, people have used Facebook data to identify peak break-up times and to predict someone’s sexual orientation based on their various connections and activity.

Follow

Get every new post delivered to your Inbox

Join other followers: