Statistically Solving Crossword Puzzles

I am lover of crossword puzzles.  I do the NYT crossword puzzle regularly, I’ve competed in the American Crossword Puzzle Tournament, and I’ve even dabbled in constructing puzzles myself.

There’s a great deal of crossover between math lovers and crossword puzzle lovers, and one example of this crossover is Matthew Ginsberg.  Ginsberg is a regular puzzle constructor, has a PhD in math from Oxford, and is an expert in artificial intelligence.

Not a huge stretch, then, that he has developed a rather effective crossword puzzle solving robot, Dr. Fill, that is now challenging the top human performers .

Ginsberg runs a company that produces software for the Air Force that helps calculate the most efficient flight path for airplanes.  Here’s the cool part:  “Some of the statistical techniques [used to calculate optimal paths of airplanes] are also handy, it turns out, for solving crossword puzzles.

Yet another example of how statistical reasoning is emerging as primary tool in modern science and society!

Superbowl Scoring

After enjoying a well-contested Superbowl that seemed to appropriately represent the teams, the season, and the league in terms of the level of play and competitiveness, I started wondering about how the big game compares to regular season play.  I wondered if teams performed better or worse, on average, given the pressure and scrutiny of the championship game.

I thought a simple place to start examining this question would be to look at Superbowl scoring versus regular season scoring.  Below is a chart showing the difference (Superbowl Score – Average Regular Season Score) for all 46 Superbowls.

At the far right, we see the results of Superbowl 46:  Giants 21, Patriots 17.  The league average in scoring this years was 22 points per game, so the difference here is 38 – 44 = -6.

It seems as though it is more common for more points to be scored in the Superbowl than in an average regular season game.  Unfortunately, there are a lot of stories one could tell about why that might be so:  better teams (and therefore better offenses) make it to the Superbowl; defenses are more susceptible to pressures of the big game; the extra preparation time gives offensive coordinators and advantage.

So how could we more rigorously explore the quantitative characteristics of the Superbowl?

Yet Another Way to Lie With Statistics

This is a nice takedown of some spurious economic analysis, courtesy of Freakonomics:

http://www.freakonomics.com/2011/03/30/how-to-spot-advocacy-science-john-taylor-edition/

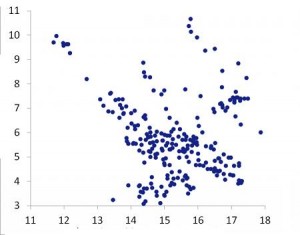
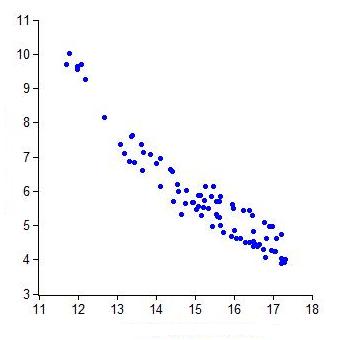
Looking at the graph at the right, it’s hard not notice the negative correlation between the two given variables, and the economist in question uses that correlation to bolster his policy argument.

The graph looks a lot different, however, when you look at all the available data, not just the data between today and the arbitrarily chosen cut-off of 1990.  But that chart doesn’t support the argument as decisively.

As the author suggests, “Be wary of economists wielding short samples.”

The Year in NFL Scoring

football-in-airAs the books close on the 2011 NFL regular season, it’s time to revisit my pre-season prediction that the new kickoff rule would result in a slight decrease in per-game scoring.

The pre-season predictions on the number of touchbacks turned out to be fairly accurate.  In 2011, about 43% of kickoffs (922 out of 2151) resulted in touchbacks; in 2010, only 16% of kickoffs (359 out of 2221) resulted in toucbacks (thanks to NFL.com for the data).

Did the increase in touchbacks reduce overall scoring in 2011, as hypothesized?  No.  In 2011, around 44.4 points were scored per game in the NFL; in 2010, around  44.1 points were scored per game.  Per-game scoring actually increased slightly this year !

One issue worth mentioning, however, is the disproportionate effect the top three scoring teams have on the data.  During the 2010 season, New England was the highest scoring team in the league with 518 points total points; this was nearly 80 points more than the second highest scoring team.  In 2011, the Packers, Saints, and Patriots all scored over 500 points!  If we remove the three highest-scoring teams from each season, scoring for the rest of the league actually drops about 0.7 points per game.

It’s been fun drilling down into the data this year, and many other interesting questions popped up along the way.  And off-season changes always create new opportunities for analysis.

Related Posts


More on NFL Scoring

lions-johnsonAs the Detroit Lions prepare for their first compelling Thanksgiving Day game in 15 years, I thought I would revisit my pre-season hypothesis that scoring in the NFL would be down in 2011 due to the new kickoff rule.

A quick recap of my argument:  the new kickoff rule will result in more touchbacks, which will reduce overall starting field position, which will result in fewer points being scored.  An elementary analysis suggested that per-game scoring would be down by about 2 points per game.

The first two weeks of the season saw record-setting offensive production:  scoring was actually up by 2.5 points per game!  But now, with more than half the 2011 NFL season in the books, the average points-per-game is 44.07.  During the 2010 NFL season, the average points-per-game was around 44.16.

A TV analyst recently suggested that scoring decreases as the season progresses, due to factors like weather and injury.  Not only does this give me another idea for a math and sports analysis, it also gives me hope that perhaps my pre-season prediction may still come true!

Related Posts


Follow

Get every new post delivered to your Inbox

Join other followers: