An Autobiography in Data

Stephen Wolfram has given the world Mathematica, MathWorld, and Wolfram Alpha.  His latest contribution to the evolution of mathematics is a highly compelling analysis of 20 years of personal data.

http://blog.stephenwolfram.com/2012/03/the-personal-analytics-of-my-life/

Wolfram has collected data on his emails, his phone calls, and even his keystrokes for the past two decades.  In the above piece, Wolfram takes a look at what that data has to say about his life.  Why did his sleeping habits change around 2002?  What time of day are you most likely to catch him on the phone?  What percentage of keystrokes over the past 20 years have been backspaces?

The results are interesting not merely because Wolfram is such a fascinating person, but because of the potential personal data collection has for all of us.  What sorts of data would tell your story?

What a wonderful idea to explore!  Thanks for sharing, Mr. Wolfram.  You’ve given us a lot to think about.

Leap Day Birthdays

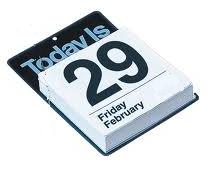
In my Leap Day contribution to the New York Times Learning Network, “10 Activities for Learning About Leap Year and Other Calendar Oddities,” I calculated the odds of a person having a Leap Day birthday.

Assuming each day of the year is an equally likely birthday, and noting that there is one Leap Day every four calendar years, I calculated the probability to be

(Leap Day Birthday) = \frac{1}{4*365 + 1} = \frac{1}{1461} \approx 0.0068

or around 0.7%.

So how many people with Leap Year birthdays do you know?

Math Lesson: 10 Ways to Celebrate Leap Year

My latest contribution to the New York Times Learning Network is a collection of teaching and learning ideas that use the New York Times to explore leap year and other calendar oddities.

https://learning.blogs.nytimes.com/2012/02/27/10-activities-for-learning-about-leap-year-and-other-calendar-oddities/

The activities include day-of-the-week calculations, alternate calendar conventions, days and years on other planets, and reflections on the value of one extra day.

In short, there are plenty of ways to make the most of this quadrennial event!

On Coin Distributions

Inspired by a recent foray into Piggy Bank Estimations, I started thinking about the following question:  how are coins distributed?  That is, what percentage of coins in a collection of random change are pennies?  Nickels?  Dimes?  Quarters?

I began with two assumptions.  They are debatable, like most assumptions are, but they seem like a good place to start an investigation:

1)  Every amount of change is equally likely to be received.

2)  Every amount of change is provided using the minimum number of coins.

What (1) means is that you are just as likely to get 13 cents back in change as you are to get 91 cents when you purchase something.   And (2) means that, when you get that 91 cents back, you’ll get it as 3 quarters, 1 dime, 1 nickel, and 1 penny; not 4 dimes, 9 nickels, and 6 pennies.

I made a chart in Excel of all the possible change amounts from 1 to 99.  I then figured out how many of each coin would be used to provide that amount of change, assuming that change was given efficiently.

Now, assuming each change amount is equally likely, we can simply count the total number of coins and then figure out each percentage as a share of that total.  The total number of coins in the list is 466.  The number of each coin, and it’s approximate percentage, is given below.

By this analysis,  a large, random collection of coins should be roughly 42.5% pennies, 8.5% nickels, 17% dimes, and 32% quarters.   Do me a favor:  the next time you find yourself sitting on a big pile of change, see how it stacks up against these numbers and let me know.

And if you like, you can check this theoretical ratios against the actual numbers in my Piggy Bank.

Pricing Models

This is an interesting article about variations on the pay-what-you-wish pricing model that has gained some attention in the last few years.

https://www.discovermagazine.com/planet-earth/caring-with-cash-or-how-radiohead-could-have-made-more-money

The band Radiohead famously offered their album “In Rainbows” on their website and asked fans to pay whatever they wanted for the download.  The actual sales numbers are well-guarded, but  it appears to have been a success.

The above article details how an amusement park merged the pay-what-you-want approach with a half-goes-to-charity approach (telling the customer that half of the purchase price is donated to charity).  The product in question was a picture of the customer riding a roller coaster.  Let’s abbreviate with PWYW (Pay What You Wish), HGTC (Half Goes to Charity), and PWWTY (pay-what-we-tell-you):

Percent Sales Average Sale Price
PWWTY .5% $12.95
PWWTY & HGTC .57% $12.95
PWYW 8.4% $0.92
PWYW & HGTC 4.5% $5.33

When given the opportunity to pay whatever they wanted, participation increased dramatically, but revenue was still low–only 92 cents per person.  But when combined with the half-goes-to-charity approach, participation was much higher and the price paid was significantly higher.  Even after taking out the half for charity, revenue was still up by a factor of three!

This is a very interesting approach to pricing, and there are some cool psychological and sociological principles at work here.  And it’s another set of factors to consider when that salesperson is working on you.

Follow

Get every new post delivered to your Inbox

Join other followers: