Poor Metrocard Management

As one who prides himself on his quantitative reasoning abilities, I am embarrassed at how poorly I manage my Metrocard.

Ever since I switched from buying unlimited cards every month to purchasing cash cards as needed, I’ve been having serious problems.  I really don’t plan ahead, so I’m usually in a rush when I discover that my current card has run out.  When this happens, I’ll just quickly buy a new card with $50 on it, without thinking through the quantitative consequences.

A single ride costs $2.25.  In addition, there is a Bonus system in place where you get additional credit for putting money on your card.  It’s obviously too complicated for me to work out, because I keep ending up with cards that have less than $2 on them.

There are three of them in my wallet right now.

The value of my current card actually ends in $0.10.  I honestly have no idea how that happened.

I guess it’s time for me to review my own post about maximizing Metrocard management.

Mathematically Modelling Collusion

This is a fascinating application of graph and network theory:  modelling corporate inter-connectedness and measuring the influence of large corporations around the world:

https://www.newscientist.com/article/mg21228354-500-revealed-the-capitalist-network-that-runs-the-world/?ignored=irrelevant

A team of complex systems analysts created a map of how 40,000 transnational companies are connected to each other.  Using quantitative factors (like amount of shares of company X held by company Y, and the economic relative strength of company X), the team developed a way to measure the influence a company exerts over another.

In addition to looking at individual companies, this measurement for the evaluation of the system as a whole in terms of equity and stability.  The team found that a sub-network of 147 tightly knit companies exerted a disproportionate influence over the entire network.  The high level of interconnectedness of this group concentrated power in the network, allowing this small group of less than 1% of the companies to effectively control 40% of the network.

An innovative application of mathematics to the fields of economics, politics, and social justice!

NFL Playoff Overtime Rules: The Case for Deferring

I have enjoyed analyzing and writing about the strategy implications of the NFL’s Playoff Overtime rules, and we’ve seen those rules in action for the first time this year.

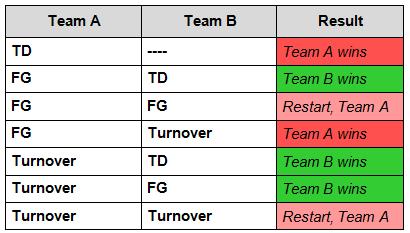
Here’s a short summary:  the first possession in overtime is determined by a coin flip.  The first-possessing team will be known as Team A, and the other team will be Team B.  If Team A scores a touchdown, they win immediately; if Team A scores a FG, then Team B will receive the ball and can win (with a TD), tie (with a FG), or lose (with a turnover).  Aside from the specific first- and second-possession situations governed by these rules, the rest of overtime plays out in classic sudden-death style.

I looked closely at whether it is useful for Team A to attempt a FG, but the question that occurred to me recently was “If you win the coin toss, is it obvious that you want the ball first?”

Consider the following chart.  Again, Team A is the first-possessing team, and Team B is the other team.  The chart shows all the possible sequences of outcomes on the first two possessions:  touchdown (TD), field goal (FG), or Turnover.  Here, a turnover could be a fumble, and interception, a punt, or a turnover on downs.
playoff-ot-possession-chart

The first-possessing team, Team A, certainly has an advantage in that they can end the game immediately by scoring a touchdown.  But if they don’t score a touchdown, Team B can always win with a TD and in some cases can win with only a FG!  Furthermore, as the original kickoff team, Team B may enjoy a strategic advantage in field position, which can further affect the above scenarios.

Now, in all situations where the game is not decided within the first two-possessions, Team A gets the ball first as sudden-death rules take over.  However, I recall analyses that suggest that the first possessing team doesn’t have a statistically significant advantage in sudden-death overtime.

This is an admittedly elementary look at the situation, but it seems to me that the answer to the question “Do we want the ball first in OT?” is not obvious.  Hopefully I’ve given the coaches something to think about this week.

Related Posts


Applications of Mathematics

This is an amazing resource from the British Columbia Institute of Technology:  a cross-referenced list of how various mathematical ideas are used in various technology fields.

http://commons.bcit.ca/math/examples/

Interested in how Linear Algebra can be applied to Nuclear Medicine?  Or how Logs and Exponentials can be applied to Forestry and Wildlife?  Or how Differential Equations can be applied to Mechanical Engineering?

Well, look no further!

Math Lesson: Mathematics, Elections, and the NYT

My latest contribution to the New York Times Learning Network is a collection of teaching and learning ideas that use  New York Times resources to explore the mathematics of elections.

https://learning.blogs.nytimes.com/2012/01/25/the-united-states-of-numeracy-the-math-of-a-presidential-campaign/

The ideas cover both primary and presidential elections, and involve polling, demographics, campaign finance, and even a little graph theory!

Follow

Get every new post delivered to your Inbox

Join other followers: