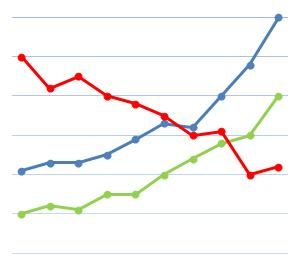
 My latest contribution to the New York Times Learning Network is a math lesson built around gathering, representing, and analyzing economic indicator data.
By getting data on Real G.D.P., personal income, corporate profits, and unemployment from official sources like the Bureau of Economic Analysis and the U.S. Department of Labor, students explore positive and negative correlations between the various economic indicators.
In addition, students can explore the relationships between graphs of quantities and their rates of change by creating and comparing graphs of percent change.


