World Cup Predictions

I went over to ESPN and tallied up the total number of goals in this year’s World Cup:  I counted 139 goals in 62 matches (margin of error:  +/- 3 goals?), for an average of 2.24 goals per match.  That’s total.  For both teams.  Think about that.

Will the final be similar?  The Netherlands has averaged 2 goals per game (12 goals in 6 games)  over the first 6 games of the WC, and Spain has averaged 1.16 goals per game (7 goals in 6 games).  So maybe the final will see closer to 3.16 total goals?

It might be important to also consider these teams goals against average:  the Netherlands has conceded .83 goals per game (5 goals in 6 games), and Spain has only allowed .33 goals per game (2 goals in 6 games).  This simplistic analysis suggests something around 1.16 goals in tomorrow’s final.

My prediction–two total goals.  If I were you I’d take the under.

Lebron and the Efficient Market Hypothesis

The efficient market hypothesis (EMH) says, in its strong form, that the price of an assets always perfectly reflects the value of that asset.  The idea is that all the information about an asset–public and private–gets translated into market activity, which is a kind of revelation of the asset’s real value.  It’s an elegant, if contentious, theory.

It was amusing to see the story the other day about how speculation that Lebron James was going to sign with the Knicks drove the stock price of Madison Square Garden (MSG) up 6.4%

http://dealbook.blogs.nytimes.com/2010/07/08/lebron-knicks-speculation-pumps-up-msg-stock/ .

I guess this is a good example of how the EMH is supposed to work:  someone finds out a secret (Lebron is signing with the Knicks), realizes the financial consequences (tens, if not hundreds, of millions more in revenue for MSG), realizes MSG stock is under-valued, and buys a bunch; other people see this and jump on the bandwagon.  At some point, the stock price levels off at its true value.

Let’s see what happens to MSG stock today.  If it goes down a bunch, I guess all those EMH’ers didn’t have the true value right yesterday.

Vuvuzelas and Surfaces of Revolution

Before the World Cup disappears forever (to me, four years = forever) , I must point out that the vuvuzela

reminds me a lot of the surface of revolution known as the Horn of Gabriel,

which is obtained by rotating the function y = \frac{1}{x} around the x-axis.  The curious thing about this surface is that it has finite volume but infinite surface area.

Thus, if this object existed in the real world, you could fill it up with a finite amount of paint, but you couldn’t cover the surface with a finite amount of paint.  If that means anything.

Player Evaluation

The New York Knicks have agreed with Amare Stoudemire on a 5-year, $100 million contract, which will likely be their only major acquisition during this much-hyped NBA free agent bonanza.  I like Stoudemire, but he strikes me as a player who, like many others, looks much better playing with Steve Nash than he’ll look with whomever the Knicks sign to play point guard.

Stoudemire can’t really create his own shot, so someone has to get Stoudemire the ball, and Nash gets scorers the ball as well as any point guard in the league.  Is Stoudemire going to look like a $20 mil / year player with Sergio Rodriguez setting him up?  As a longtime Knick-hater, I’m looking forward to 5 years of “No”.

It would be interesting and useful to quantify a player’s efficiency conditioned on whether a certain teammate is playing with him or not.  My hunch is that, for example, Stoudemire would look a lot less efficient playing without Nash than playing with him.  There is a basic evaluation of player-pairs here http://basketball-statistics.com/nbaplayerpairs.php, but these numbers don’t tell us how Stoudemire performs when Nash isn’t on the floor.

An effective analysis along these lines might have saved the Knicks some money.  In theory, anyway.

Visual Representation of Data

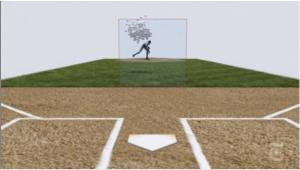
A friend claimed that this video about Mariano Rivera contained the best info-graphic ever made, and it’s hard to argue.

The whole thing is fascinating, but at about the 1:40 mark the 1300 hundred or so pitches Rivera threw in 2009 are tracked from the mound and plotted in the strike zone.  Not only is it a supremely cool visualization of statistical analysis, but it absolutely helps explain why Rivera is so successful (and, indeed, one of the greatest pitchers in baseball history).

Follow

Get every new post delivered to your Inbox

Join other followers: