Data Visualization

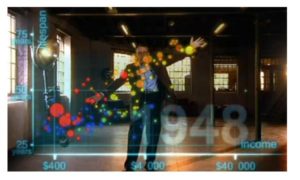
spiffier roslingThis is a fancier version of a well-known Hans Rosling video showing correlations between life-expectancy and income across time periods and geographical regions.

http://www.youtube.com/watch?v=jbkSRLYSojo

It’s truly a beautiful representation, and it really helps make sense of a large set of multi-dimensional data.

The original version is a bit more academic in feel, but you can’t blame Rosling for going a little Hollywood here.

Find Your Name in Pi

Name in PiThis is a fun and clever idea:  convert the decimal expansion of Pi into base 27 and name the “digits” A, B, C, D, … .  This creates a way to decode numbers into words and phrases (the ‘0’ digit is interpreted to be a space, or a punctuation mark).

With this in place, you you can search for your name (or any phrase) in the infinite expansion of Pi!

http://www.dr-mikes-maths.com/pisearch.html

This will certainly excite all those cosmological conspiracy theorists out there!

Related Posts


Follow

Get every new post delivered to your Inbox

Join other followers: