I have always been fascinated with menus, and one of my favorite pastimes is analyzing menus for price discrepancies.
For example, how many different prices can you spot Wendy’s charging here for the same Meal Combo upgrade?
Related Posts
I have always been fascinated with menus, and one of my favorite pastimes is analyzing menus for price discrepancies.
For example, how many different prices can you spot Wendy’s charging here for the same Meal Combo upgrade?
Related Posts
 Through Math for America, I am part of an on-going collaboration with the New York Times Learning Network. My latest contribution, a Test Yourself quiz-question, can be found here:
http://learning.blogs.nytimes.com/2011/02/14/test-yourself-math-feb-14-2011/
This problem is based on comparing the total national incomes of the United States and China. My solution offers a simple way to turn per capita income and population into meaningful percentages.
I wonder if this will be a popular query on WolframAlpha today:
Thanks to @mathematicsprof for the idea!
Related Posts
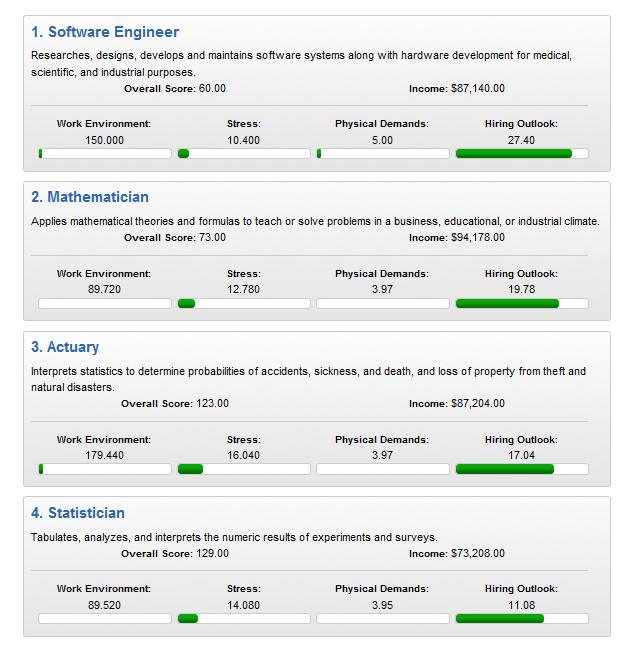
 This report from CareerCast ranks 200 jobs from best to worst:
http://www.careercast.com/jobs-rated/2011-ranking-200-jobs-best-worst
Jobs were analyzed based on five factors: Environment, Income, Outlook, Stress, and Physical Demands.
As is so often the case in these job-ranking surveys, math-based careers fared very well: coming in at #2 is Mathematician (whatever that means), #3 is Actuary (always near the top of these lists), and at #4 is Statistician (great if you like stats, I suppose).
I guess Roustabout is not as much fun as it sounds, as it placed 200th in the rankings. And I’ve met a lot of happy, successful Taxi Drivers (#192) in my life.
It’s not surprising to see Teacher in the #100 spot, with its high stress-to-income ratio. But Surgeon right behind at #101? According to the results, it’s about 3 times as stressful but about 7 times the pay.
Might be worthwhile to take a closer look at the methodology, which can be found here.