More Clever Accounting

coffee-bagWell, they got me again.

I’ve become something of a coffee snob.  A few years ago I never drank the stuff, but now I buy good coffee and enjoy it.  To me, it’s worth paying a little extra per pound to get high quality coffee.  I just didn’t realize how much I was paying per pound.

Operating under the assumption that the standard unit of coffee beans was one pound, I assumed that I had been paying around $11 per pound for my coffee.  But recently I found myself buying coffee a little more frequently than usual.  So the next time I bought a bag, I threw it on my scale.

And then I took a closer look.

coffee-closeup

The fine print says this is 12 ounces of coffee, a full 25% less than the 16 ounces I naively assumed I was buying!

Come to think of it, my coffee shop doesn’t advertise prices by the pound.  If they did that, they’d have to admit that my bag of coffee was actually around $15 per pound, not the $11 that common experience might suggest.

I might not have noticed this, had I not recently had a similar realization about my orange juice.

Related Posts

Teaching and Social Media: A Small Success

On one of those summer vacation days, full of promise and possibility, I innocently added an item to my To Do list:  start a blog and post something mathematical every day.  I saw it mostly as an intellectual exercise, one that might potentially be of use to some of my students, and I figured I’d just try it out and see where it led.  A productive waste of time, I thought.

Somewhere along the way, I started seeing, and capturing, more and more Math Photos.  Compelled to find math to think and write about, I started seeing more math around me.  People liked the photos, and my camera became a regular companion.  I began thinking more visually, more creatively.  While visiting home, I caught some light slipping through the blinds and snapped a few photos like this:

Light Trapezoid 1

A few days later, I received a message on Twitter from a digital colleague.  Jim Wilder (@wilderlab), a math and science teacher in Alabama, had shown my photos to some of his fourth-grade students.  Inspired, they went around looking for their own quadrilaterals in the shadows.  He shared this photo with me.

wilderlab student shadow

I was truly moved by this small surprise.  With barely an afterthought, I shot and posted that photo.  A fellow teacher saw it, shared it, and it’s now become a mathematical experience for a student I’ve never met.

This is just one small example of how much my professional world has changed through this process.  The impact of social media technologies on teachers and students seems virtually limitless, and it’s exciting to be a part of it in my own small way.

At the very least, it’s a productive waste of time.

Beautiful Weather Graphs

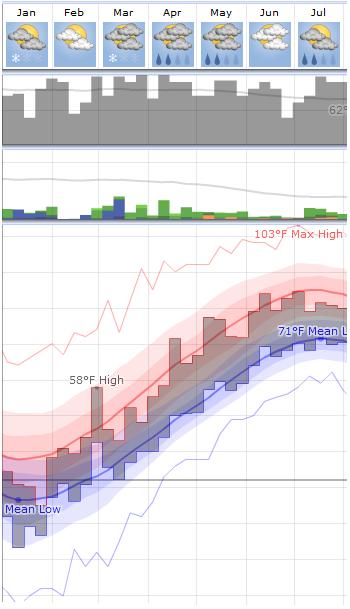
“Beautiful Weather Graphs and Maps” are promised by WeatherSpark, and they deliver.

You can get local forecasts that show a number of projections bounded by highs and lows, or you can look at daily, monthly, or yearly trends that aggregate historical data.

In another section, a variety of interactive maps allow you to look at geographic trends in temperature, wind, humidity, and many other factors.

You can even look at long-term global temperature data!

A lot of information and representation to interact with and explore here.

Follow

Get every new post delivered to your Inbox

Join other followers: