I claim that this is the minimum maximum speed. Have you ever seen anything lower?

I claim that this is the minimum maximum speed. Have you ever seen anything lower?
 Through Math for America, I am part of an ongoing collaboration with the New York Times Learning Network. My latest contribution, a Test Yourself quiz-question, can be found here
Test Yourself Math — June 3, 2013
This question is related to California’s projected $4.4 billion budget surplus. What is the per capita share of that amount?
The Prudential commercial that aired during Super Bowl 47 features what Steven Strogatz calls the most viewed histogram of all time.
According to the commercial people were asked the age of the oldest person they know, and their answers were plotted. The resulting histogram is somewhat “normal” looking, and the average age is in the low 90s.
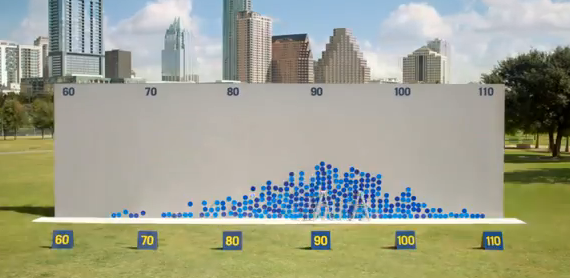
The commercial’s message is clear: “Look at how old people get! You need to be better prepared for your retirement! Come see a Prudential representative today.”
This is a good example of the subtle ways mathematics can be used to manipulate the opinions of the quantitatively unsophisticated.
The above histogram is intentionally designed to mislead viewers into thinking they may be significantly unprepared for retirement. The average life expectancy in the US is around 78 years, but this number may not be shocking enough for advertisitng purposes. So instead of life expectancy, Prudential used age of the oldest person you know, a data set whose average is about 15 years higher.
Showing a histogram that suggests people are likely to live into their 90s might motivate some viewers to head down to their local Prudential office, worried that they aren’t properly prepared for retirement. But the data on display here isn’t really relevant, and the difference is so subtle that most people won’t notice the distinction. In reality, the age of the oldest person you know has very little to do with how long you will live.
Imagine asking each member of a large group to name the salary of the highest-paid person they know. The average of these responses, the average highest-known-salary, will almost certainly be much higher than the average salary of the people in the group. It would be ridiculous to try to estimate the average salary of the group by looking at the average highest-known-salary, but in a sense, that is exactly what Prudential is doing in this commercial.
The fact that they are doing it intentionally to further their interests provides yet another example of the vital need for quantitative literacy in today’s world.
 When it comes to functions, the concepts even and odd have always been important to me as a teacher. Connecting the algebraic and geometric representations of mathematical ideas is a primary goal in my classroom, and these concepts provide great opportunities to do that.
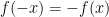
Algebraically, a function is even if 

But it wasn’t until recently that I learned the following amazing fact: Functions can essentially be uniquely decomposed into even and odd parts!
Claim: Let 

Proof: For any function 


First, we see that

Next, since 
Similarly, since 
Now, suppose
A little algebra gives us
Since the sum of even functions is even and the sum of odd functions is odd, we have an even function, 

and so
Thus, this representation of 
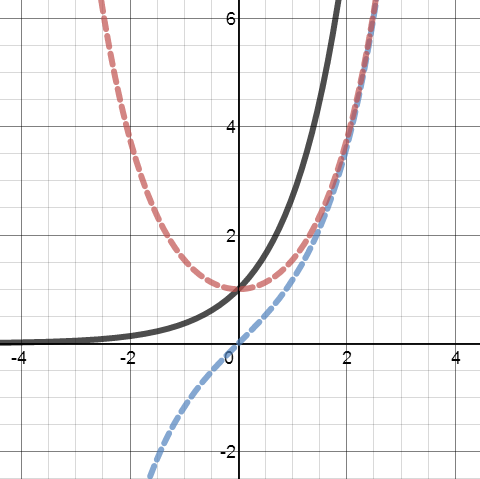
I was fortunate to encounter this unfamiliar fact at a time when hyperbolic trig functions were on my mind, which made it obvious to me where the hyperbolic sine and cosine functions come from: They are the even and odd parts of 
I also used this fact in a fun but inefficient proof that the derivative of an even function is an odd function.
Are there are other cool consequences of this unique decomposition of functions?
Related Posts