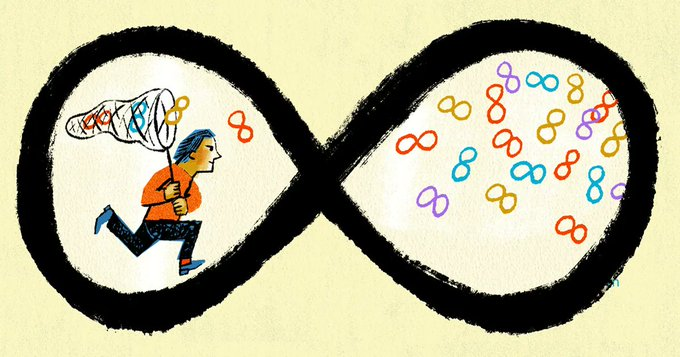
My latest column for Quanta Magazine explores one of my favorite topics: infinity!
At the end of the Marvel blockbuster Avengers: Endgame, a pre-recorded hologram of Tony Stark bids farewell to his young daughter by saying, “I love you 3,000.” The touching moment echoes an earlier scene in which the two are engaged in the playful bedtime ritual of quantifying their love for each other. According to Robert Downey Jr., the actor who plays Stark, the line was inspired by similar exchanges with his own children.
The game can be a fun way to explore large numbers:
“I love you 10.”
“But I love you 100.”
“Well, I love you 101!”
This is precisely how “googolplex” became a popular word in my home. But we all know where this argument ultimately leads:
“I love you infinity!” “
Oh yeah? I love you infinity plus 1!”
Learn how a staple of high school math — functions — can help mathematicians understand infinity and even describe the different kinds of infinities there are! The full column is available here and includes a few challenging exercises at the end.
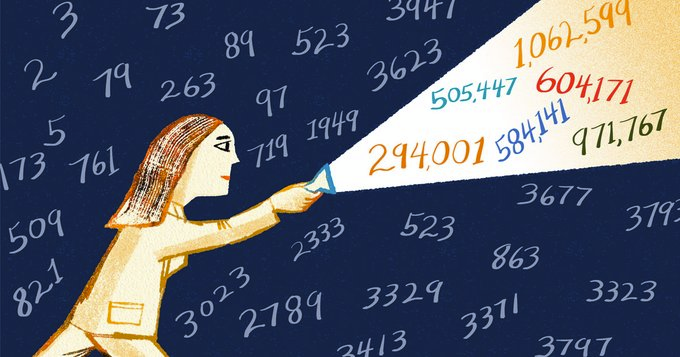
My latest column for Quanta Magazine ties recent news about “digitally delicate” primes to some simple but fascinating results about prime numbers.
You may have noticed that mathematicians are obsessed with prime numbers. What draws them in? Maybe it’s the fact that prime numbers embody some of math’s most fundamental structures and mysteries. The primes map out the universe of multiplication by allowing us to classify and categorize every number with a unique factorization. But even though humans have been playing with primes since the dawn of multiplication, we still aren’t exactly sure where primes will pop up, how spread out they are, or how close they must be. As far as we know, prime numbers follow no simple pattern.
There’s a tension among the infinitude of prime numbers — that there will always be primes close together and primes far apart — that can also be seen among digitally delicate primes, primes that become composite if any digit is changed. It may come as a surprise that any digitally delicate primes exist at all, but that’s just the beginning of their story. Find out more at by reading the full article here, and be sure to check out the exercises!
Students are learning more statistics in high school math courses than ever before, which is great: statistical literacy is essential to life in the modern world. But statistical techniques are subtle, and must be taught and tested carefully. To that point, consider question 35 from the June 2022 Algebra 2 Regents exam, which involves the important but tricky concept of statistical inference.
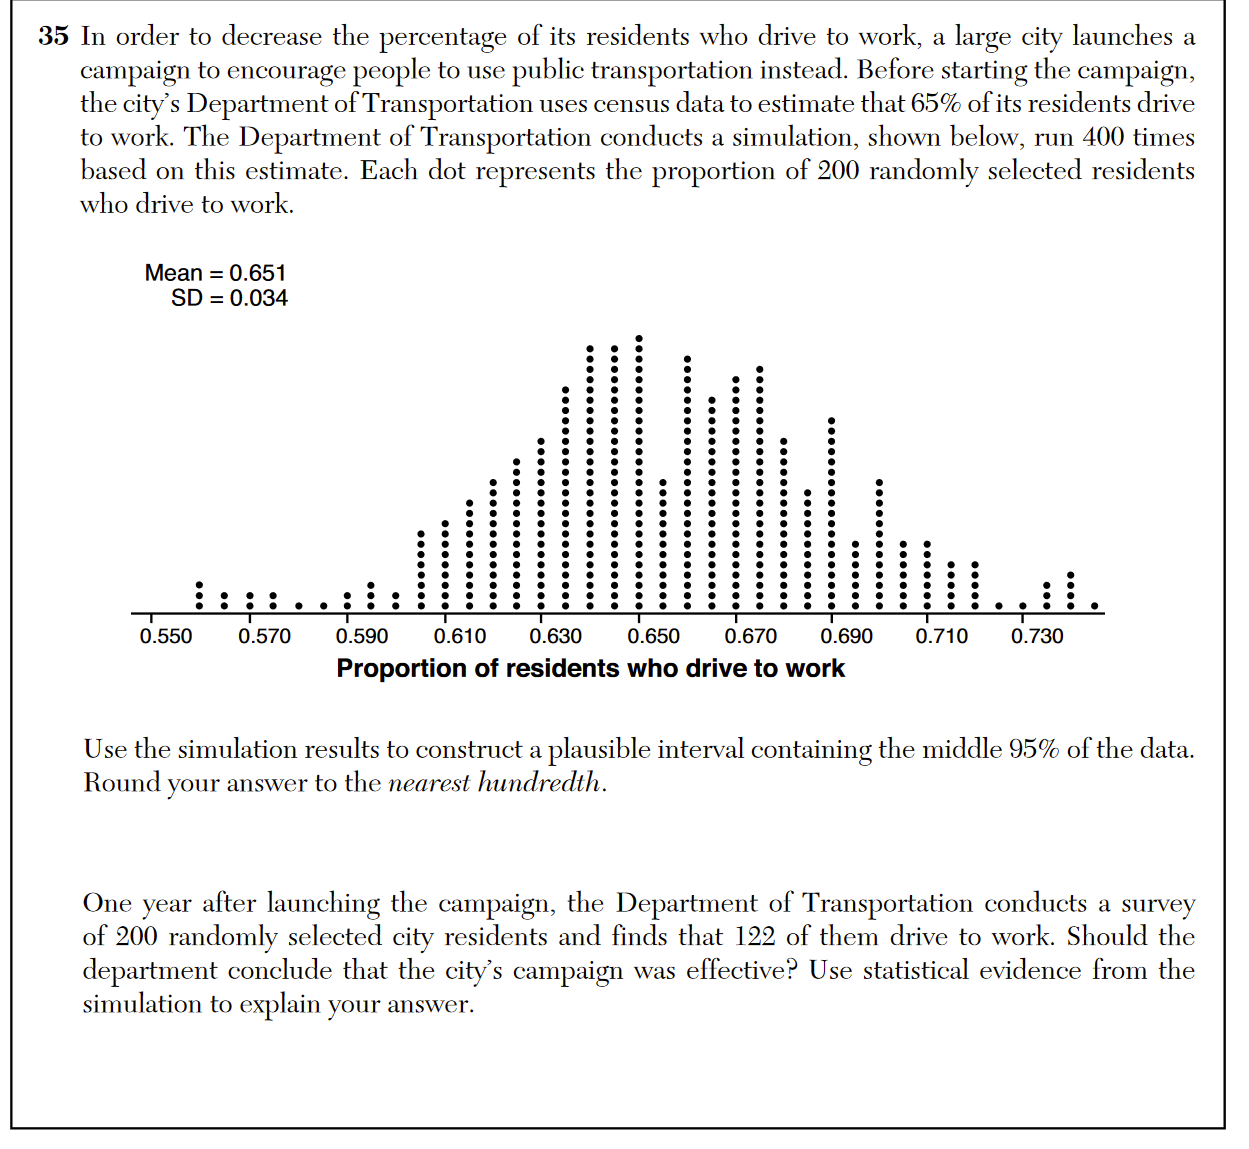
The set up of the problem establishes that 65% of a city’s residents drive to work, and an intervention hopes to reduce that percentage. The ultimate question is this: After the intervention, is a random sample of residents in which 61% drive to work evidence that the intervention was successful?
In order to establish the context for making an inference, a dot plot of sample proportions from simulated samples is shown. The trouble begins with the student directive:
“Construct a plausible interval containing the middle 95% of the data.”
What is meant by “the data” here? Does this refer to the simulation data? Because if so, that wouldn’t make sense. You don’t need to construct a “plausible interval” that contains 95% of the simulation data. It’s all right there. You can construct an exact interval that contains 95% of the data.
You don’t want an interval that contains “the data”. What you want is an the interval that contains the central 95% of the sampling distribution of sample proportions, a theoretical distribution used in making inferences. This interval in the sampling distribution can be constructed using the mean and standard deviation of an individual sample, because in the case of sample proportions the mean and standard deviation of a sample can be used to estimate the mean and standard deviation of the sampling distribution itself.
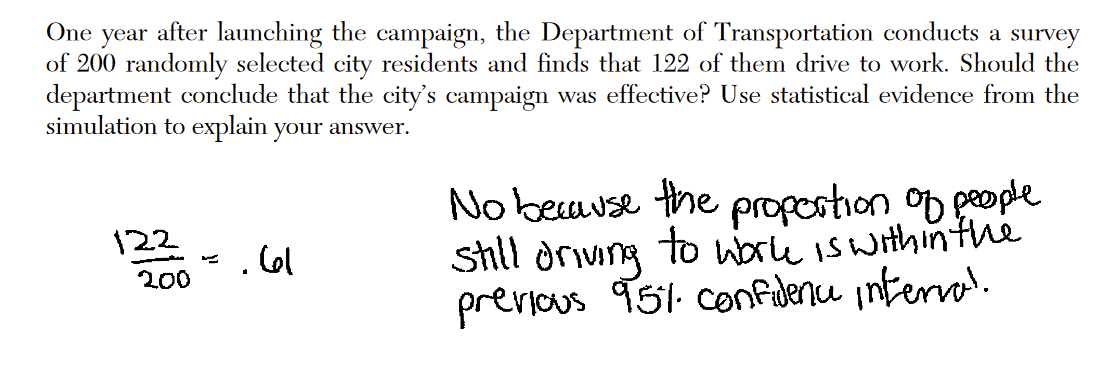
Drawing inferences using statistics is subtle, and vaguely referring to “the data” confuses and obscures the important details of the process. I spent a lot of time trying to clearly build these ideas up in my book Painless Statistics precisely because I don’t think most students and math teachers, many of whom are now occasional statistics teachers, really understand the connection between sampling distributions, estimators, and inference making. As evidence of that, consider this student response.
The student refers to the interval they’ve constructed as a “confidence interval”. While similar in structure, this is not a confidence interval: a confidence interval is used to estimate an unknown population parameter, which is not what is happening here (the population proportion has already been estimated to be 65%). The fact that this student received full credit for this response suggests there are probably more than a few math teachers out there who also think this is a confidence interval. (At least they aren’t saying a 95% confidence interval means they are 95% confident of their results, as they have done before.)
It’s good that more students are learning more statistics, but in order to teach and learn statistics properly we can’t have our standardized tests working against us.
For over 10 years I have been writing and speaking about erroneous math test questions and their consequences. Question 25 from the June 2022 New York State Algebra 2 exam offers a clear and simple picture of those consequences.
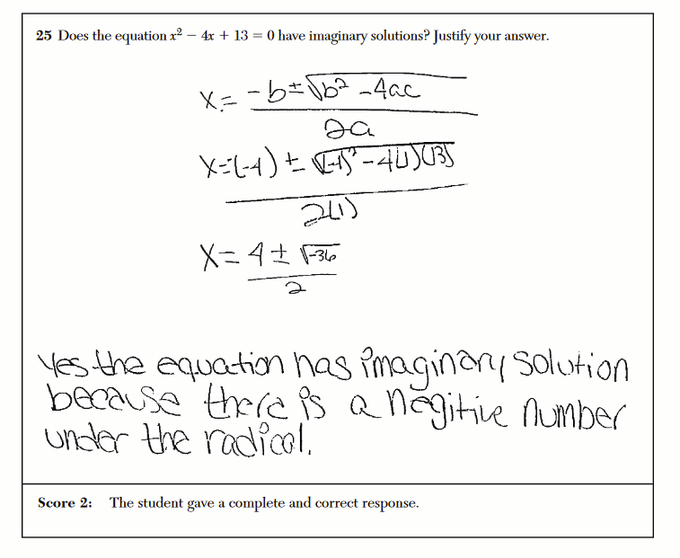
The student is asked if the equation has “imaginary solutions”, that is, if the solutions to this equation, 2 +3i and 2 – 3i, are imaginary numbers. These solutions are complex but not imaginary, because imaginary numbers are multiples of i, the imaginary unit. Therefore the answer should be no, this equation does not have imaginary solutions.
As you might have guessed, that’s not the answer they were looking for.
In this “complete and correct” response from the state’s official model response set, the student identifies these solutions as imaginary. These numbers are not real, but they are not imaginary, a subtle but meaningful distinction that neither the student nor the exam creators seem to understand.
Is the distinction important? Maybe not. But what is important is that this student’s lack of understanding of complex numbers will only be amplified by this exam. Even worse, teachers around the state might themselves be confused after reading this model response set. What will they teach their students about imaginary numbers next year?
Worst of all, what about the students who actually do know the difference between imaginary numbers and non-real complex numbers? They’re caught in a trap: Should they give the correct answer and possibly lose points, or should they try to guess what the exam creators really meant to ask? These tests put students in this trap over and over and over again, and ultimately students learn that details don’t matter and that thinking too much is a hazard. Students, and their teachers, deserve better.
On the one hand, it’s good that standardized math tests are trying to include more examples of mathematical modeling, one of the true applications of math to the real world. On the other hand, if these tests promote a false, even dangerous, idea of what a mathematical model is, then they shouldn’t bother trying.
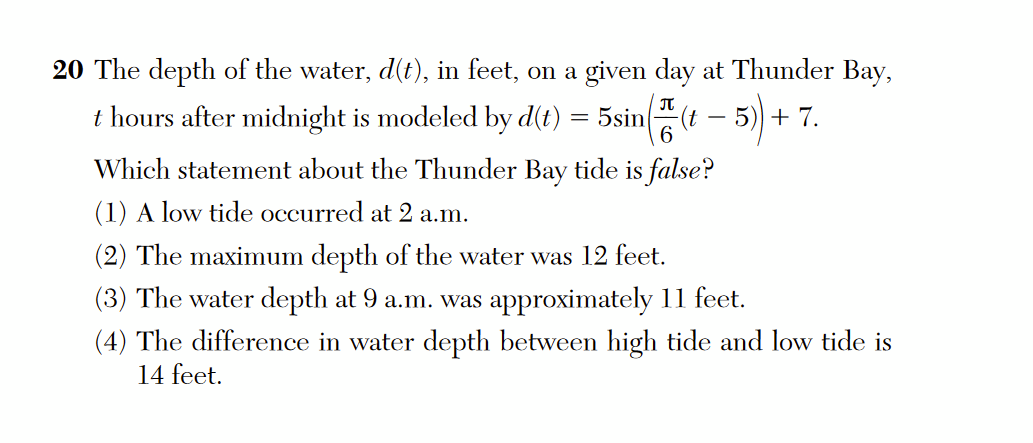
This question from the New York State Algebra 2 Regents exam commits a fundamental error of mathematical modeling: it confuses the model for the phenomenon itself.
Is the maximum depth of the water 12 feet? We don’t know. The model of the water’s depth, d(t), takes a maximum value of 12 feet, but the model is only an approximation of reality. The actual maximum depth of the water is likely to differ from the model, as are the times of high and low tide. We can’t draw specific conclusions like (1), (2), or (4), we can only approximate. This means that all these statements are probably false.
Oddly enough, answer choice (3) seems to understand that models are just approximations, which makes the other answer choices even less defensible. (And all of this ignores the question of whether or not students have the requisite domain-specific knowledge of oceanography to understand what high- and low- tides are.)
In the grand scheme of these exam errors, this is a minor footnote. But as I’ve argued in these posts, and in my talk g = 4, and Other Lies the Test Told Me, these kinds of errors have a cumulative effect of training students to stop thinking when doing and applying math and instead just try to guess what the question writer wants to hear. We should expect more from our assessments.

 has “imaginary solutions”, that is, if the solutions to this equation, 2 +3i and 2 – 3i, are imaginary numbers. These solutions are complex but not imaginary, because imaginary numbers are multiples of i, the imaginary unit. Therefore the answer should be no, this equation does not have imaginary solutions.