Introducing Painless Statistics

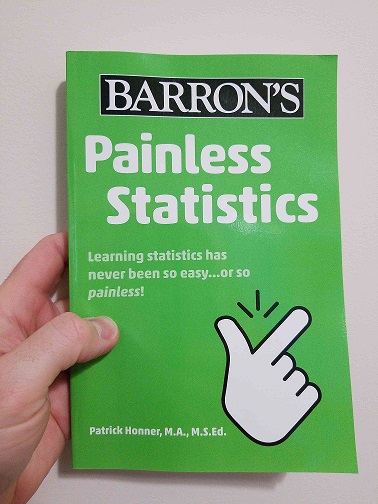
I am thrilled to announce the release of my new book, Painless Statistics!

Painless Statistics, an entry in the Barron’s Painless series, is written to serve as both a supplementary resource for students taking statistics in school as well as a stand-alone resource for adults who are learning (or re-learning) stats on their own.

Painless Statistics begins with an example of working with data, and covers everything from summary statistics and representations of data to sampling distributions and statistical inference. The book also includes plenty of problems that get you thinking about and applying the important ideas in each chapter.

My hope is that Painless Statistics can be a useful resource for middle school, high school, and even college students learning statistics, as well as for lifelong learners interested in understanding the fundamental mathematical ideas at the intersection of statistics, probability, and inference.

I also think the book would be a great resource for any math teacher who might not see themselves as a statistics teacher but would like to better understand the fundamental ideas in statistics. If by reading Painless Statistics you learn 10% of what I learned by writing it, I think you’ll find it a worthwhile purchase.

If you or someone you know is learning statistics, or would like to learn statistics, please consider picking up a copy of Painless Statistics! It will be available in bookstores everywhere starting June 7th, and you can also order it online. I’ve included the Table of Contents below, and you can take a look inside at the first chapter here.

Painless Statistics Table of Contents

Chapter One: An Introduction to Data

Chapter Two: Data and Representations

Chapter Three: Descriptive Statistics

Chapter Four: Distributions of Data

Chapter Five: The Normal Distribution

Chapter Six: The Fundamentals of Probability

Chapter Seven: Conditional Probability

Chapter Eight: Statistical Sampling

Chapter Nine: Confidence Intervals

Chapter Ten: Statistical Significance

Chapter Eleven: Bivariate Statistics

Chapter Twelve: Statistical Literacy

What a Math Party Game Tells Us About Graph Theory — Quanta Magazine

My latest column for Quanta Magazine explores some deep (and recent!) results in graph theory using a simple mathematical party game. Trying to get your entire group of friends to each shake an odd number of hands leads to some fundamental and surprising results, like the impossibility of some simple configurations.

This also ties in to some recent research that has determined new bounds on the way a graph can be partitioned into subgraphs. You can read the full article here, which includes some fun and challenging exercises at the end.

The All 1s Vector

Here’s a short post based on a Twitter thread I wrote about a very underappreciated vector: The all 1s vector!

Image

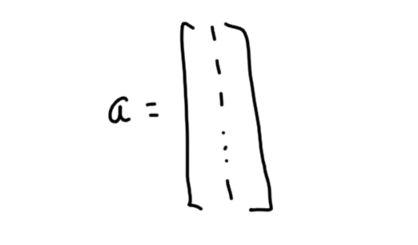
Every vector whose components are all equal is a scalar multiple of the all 1’s vector. These vectors form a “subspace”, and the all 1’s vector is the “basis” vector.

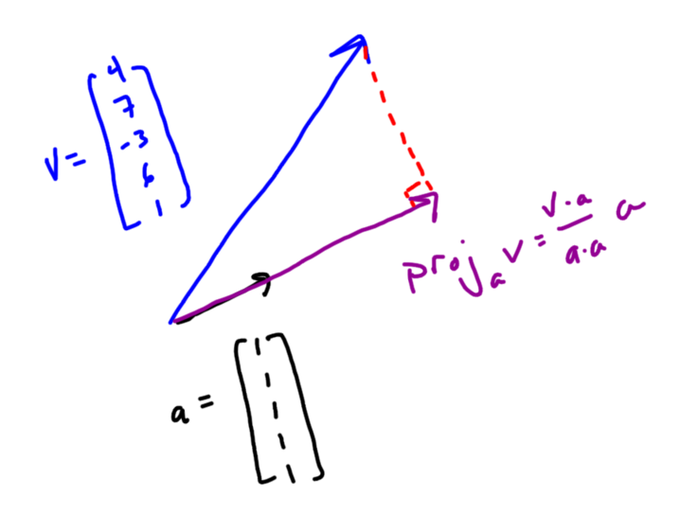
Let’s say you have a list of data — like 4, 7, -3, 6, and 1 — and you put that data in a vector v. An important question turns out to be “What vector with equal components is most like my vector v?”

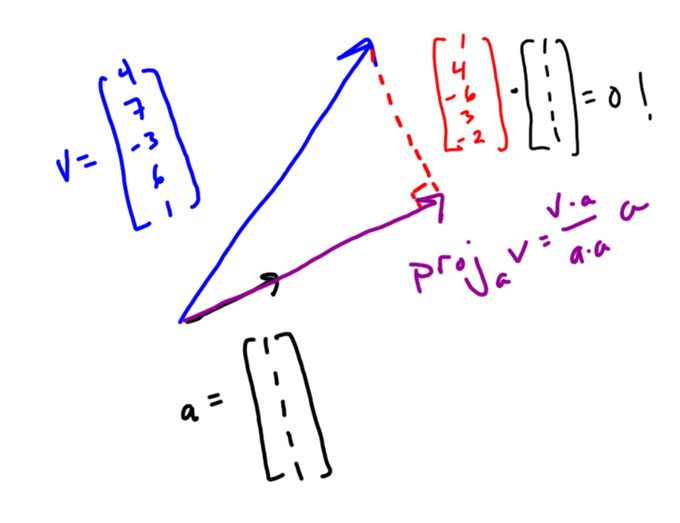
To answer that question you can *project* your vector onto the all 1’s vector. You can think of this geometrically — it’s kind of like the shadow your vector casts on the all 1’s vector. There’s also a formula for it that uses dot products.

Image

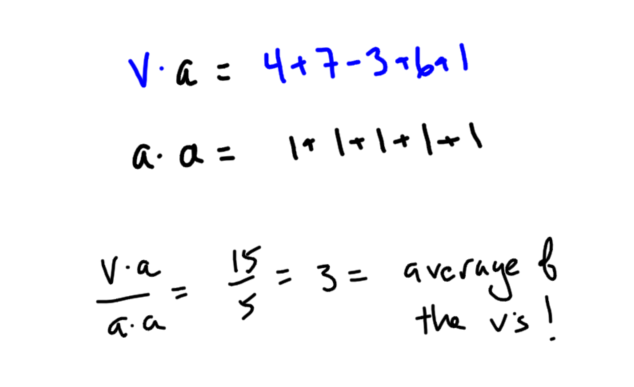
Because of the way the dot product works and the special nature of the all 1’s vector, v•a is the sum of the elements of v and a•a is the number of elements in v. This makes (v•a)/(a•a) the mean of the data in v!

Image

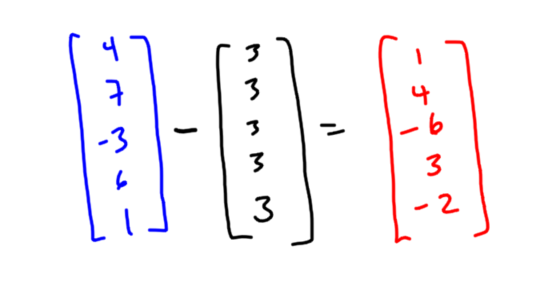
Since 3 is the mean of your data, the vector with equal components that is most like your vector is the all 3’s vector. This makes sense, since if you’re going to replace your list of data with a single number, you’d probably choose the mean.

Now the cool part. Look at the difference in these two vectors: These are the individual deviations from mean for each of your data points, in vector form!

Image

And geometrically this vector of deviations is perpendicular to the all 1’s vector! You can check this using the dot product.

Image

So data can be decomposed into two vector pieces: one parallel to the all 1’s vector with the mean in every component, and one perpendicular to that with all the deviations. You can see hints of independence, variation, standard deviation lurking in this decomposition.

You can check out the original thread on Twitter here, including some very interesting replies!

Related Posts

Making Math by Design — Queen’s College

I’m excited to be visiting Queen’s College on Tuesday to speak to students in QC’s TIME 2000 program. TIME 2000 prepares future teachers by having cohorts of undergraduates study math and education together. The program also puts on a great conference that shares the fun and beauty of math with high school students.

I’ve participated in the conference several times, but on Tuesday I’ll be speaking at the TIME 2000 Spring Seminar series. In Making Math by Design I’ll talk about the decisions that teachers make, and the consequences of those decisions, when we design and implement mathematical tasks for our students. I’m looking forward to doing some math together and having a good conversation about it afterward.

It’s been several years since I’ve visited Queen’s College, and I’m excited to be heading back, especially since this talk was originally scheduled for 2020 and was my first in-person talk cancelled by the pandemic! Let’s hope nothing else happens before Tuesday.

Related Posts

Follow

Get every new post delivered to your Inbox

Join other followers: