Who Employs Mathematicians?

Here is a great resource from mathscareers.org:  a collection of links to the Careers pages of various companies that employ mathematicians.

http://goo.gl/m5mIt

It’s easy to envision using math in fields such as Accounting, Education, and Academic Research, but there are also links to Automotive companies, the Food and Drink industry, and Pharmaceuticals.  What a great place for a young mathematics students to get a feel for some of their options!

And here’s another great resource from the same organization:  a set of excellent video interviews about the importance of mathematics skills in industry.

Street Fighting Mathematics

Sanjay Mahajan’s Street Fighting Mathematics is a short, dense, and engaging book that explores some mathematical problem-solving techniques not typically taught in math class.

These techniques, favored by engineers and scientists who are usually more interested in the answer to a question than in the mathematical theory that gets them there, can turn seemingly intractable problems into simple ones, often just by a change in perspective.

For example, the book offers a short treatment of Feynman’s differentiating-under-the-integral approach, one of the more famous “back of the napkin” techniques.  Mahajan even “guesses” the definite integral that yields the area under the bell curve, using dimensional analysis the likes of which I’ve never seen.

A “Street Fighting Mathematics” course is offered through MIT’s OpenCourseWare, which includes lectures, notes and problem sets.  In addition, Mahajan has made the book available for free in PDF format.

Yet Another Way to Lie With Statistics

This is a nice takedown of some spurious economic analysis, courtesy of Freakonomics:

http://www.freakonomics.com/2011/03/30/how-to-spot-advocacy-science-john-taylor-edition/

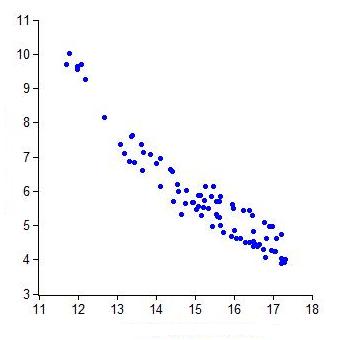
Looking at the graph at the right, it’s hard not notice the negative correlation between the two given variables, and the economist in question uses that correlation to bolster his policy argument.

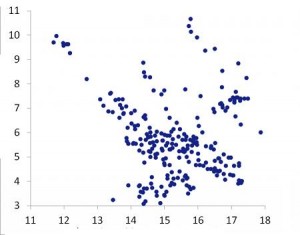
The graph looks a lot different, however, when you look at all the available data, not just the data between today and the arbitrarily chosen cut-off of 1990.  But that chart doesn’t support the argument as decisively.

As the author suggests, “Be wary of economists wielding short samples.”

Follow

Get every new post delivered to your Inbox

Join other followers: