TEDxNYED

I am honored and excited to be presenting at this year’s TEDxNYED conference on April 28th, 2012.

TEDx conferences are local, self-organized events inspired by TED, an organization devoted to “ideas worth spreading”.

The theme of this year’s TEDxNYED is “Created.  Instructed.  Connected,” and the list of speakers is impressive.  It includes Bre Pettis, a founder of Makerbot,  Christopher Emdin from Columbia University, and Frank Noschese, a well-known physics teacher and blogger.

The full line-up of speakers can be seen here.

http://tedxnyed.com/2012/speakers/

I look forward to participating and learning at this event, and I’m sure I’ll come back with many great ideas to share!

Math Lesson: Filling Out Tax Forms

Here is a math lesson I put together for the New York Times Learning Network that is built around parsing income information and properly filling out tax forms.

https://learning.blogs.nytimes.com/2011/04/11/no-taxation-without-calculation-filling-out-tax-returns/

This lesson supplies students with cost-of-living scenarios and mocked-up W2 and 1099-INT forms and challenges them to work their way through Federal Form 1040EZ.

A few older students might like to try this, too!

Math Lesson: Economic Recovery

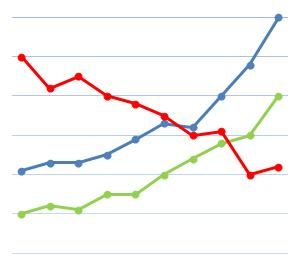
My latest contribution to the New York Times Learning Network is a math lesson built around investigating the indicators analysts use to classify and predict economic recovery.

https://learning.blogs.nytimes.com/2012/03/28/on-the-road-to-recovery-analyzing-economic-indicators/

By collecting and analyzing data presented in Times infographics and other official sources, students can analyze the various economic indicators to assess the current condition of the U.S. economy.

By comparing and contrasting the various indicators, and connecting these abstract measures with their own personal experiences, students begin to build understanding of the complex task of quantifying economic performance.

Follow

Get every new post delivered to your Inbox

Join other followers: