Here is another installment in my series reviewing the NY State Regents exams in mathematics.
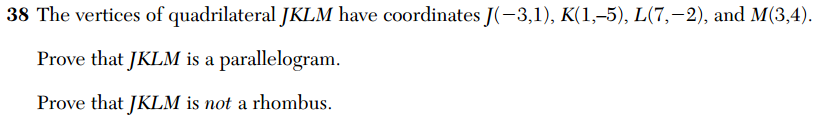
The following item appeared on the 2014 Geometry exam. It was the highest-valued item on the exam, the only six-point question.
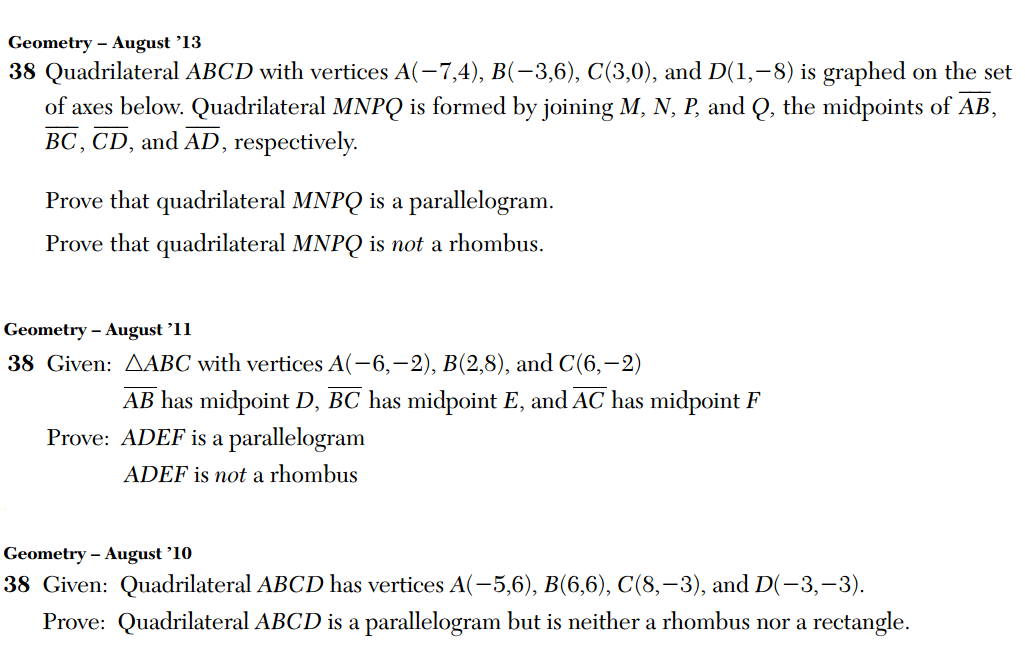
There’s nothing particularly unusual about this problem. In fact, similar problems have appeared on prior exams. Here we see the lone six-point problems from the 2013, 2011, and 2010 Geometry exams.
The problems are all very similar, yet there is one subtle difference between the 2014 version and these three prior versions: the 2014 version contains one less substantial task than the three previous versions. That is, it requires less work than previous versions, but is still worth six points.
In 2014, the student is asked to prove that a given quadrilateral is a parallelogram, but not a rhombus. In 2010, the student had to do these two things, but in addition prove that the quadrilateral wasn’t a rectangle.
In 2013 and 2011, the student was asked to prove two similar results, but first had to construct a new quadrilateral from the given quadrilateral. This preliminary work involves repeated application of the midpoint formula.
I don’t really think this is a big deal, but it does point to the subtle ways in which tests, scores, and results can be manipulated. Test results have become highly politicized in recent times: politicians routinely take credit for improving graduation rates and closing achievement gaps. But without scrutiny of the tests themselves–their content, their construction, their scoring–it’s difficult to put such claims in their proper perspective.