I enjoyed reading through this marketing document from Harris Interactive about the popularity of Major League Baseball. Lots of interesting facts about who watches baseball (higher percentage of people in the East versus other regions; percentages rise with income), and a nice ranking of the league’s most popular teams.
Putting the popularity rankings together with team salary information, I made myself a nice little scatter plot.
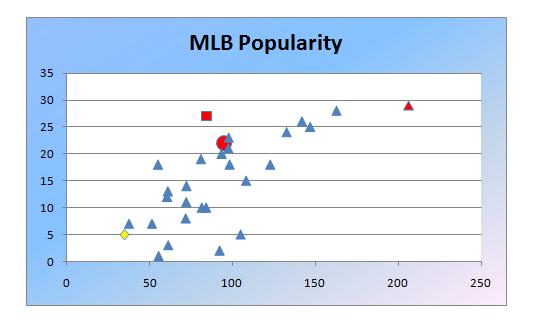
Team payroll along the horizontal is in millions, and the popularity is out of 30 teams, with 30 being “most popular”.
Not too hard to guess the red triangle in the upper right: first in popularity and team payroll, your New York Yankees! The World Series Champion San Francisco Giants are the big red circle around (93,23). And kudos to the Atlanta Braves, the nice red square in the top middle, as they seem to be getting the best popularity return for their payroll dollars. The sad yellow diamond in the bottom left is for one particular reader: maybe next year!
There does seem to be a positive relationshp between the amount spent on salary and the team’s overall popularity, but there are probably a lot of reasons for that.
Lots of other interesting ways to slice and dice this data. Take a look at the document and try it yourself!