New NFL Overtime Rules and Strategy

At the beginning of the 2011 playoffs, the NFL implemented a new set of overtime rules that drastically altered how tie games would be decided.  The rules entail many significant strategic consequences, and I’m not sure how well-understood those consequences are.

The old overtime rule is straightforward:  initial possession of the ball in overtime is determined by a coin-toss, and the first team to score is the winner.  Critics of this model argued that since initial possession of the ball was such an advantage, awarding it based on a coin-toss essentially made the outcome of the game equivalent to a coin-toss.  The argument seems reasonable, although whether the data backs it up is a story for another time.

The NFL’s new system tries to counterbalance the advantage of initial possession.  From here on out, let’s call the team that wins the coin-toss, and therefore begins overtime with the ball, Team A.  In the new system, Team A can win the game on its initial possession only if they score a touchdown.  If Team A scores a field goal on their initial possession, Team B will receive the ball and have a possession to then try to win or tie the game.

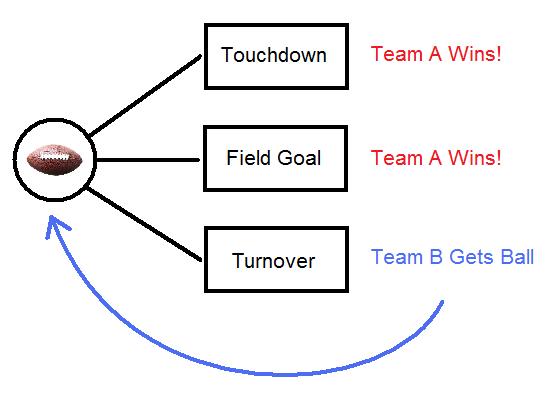
Here is a diagram illustrating the old system.NFL OT Old RuleThe basic idea here is if Team A scores, they win.  If they don’t, then Team B gets the football and starts at the front of the graph.
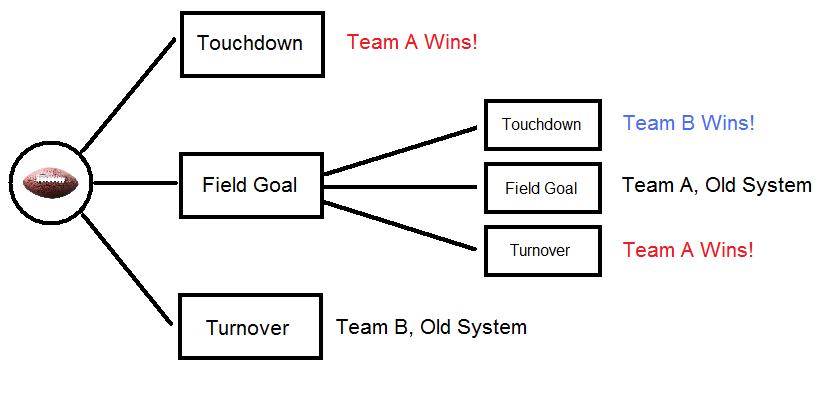
Here’s a graph representing the new system.

This system is far more complex.  First of all, Team A now has a great incentive to try for a touchdown on its first possession, whereas under the old system, they had virtually no incentive to do so.  Furthermore, the value of a field goal for Team A on its initial possession has been greatly decreased.  Under the old system, a first-possession field goal won the game.  Under the new system, its value is considerably less.NFL OT New RuleWhat are the consequences of these new realities?
Consider a long field goal on the initial possession.  Make it, and your opponent gets the ball and can beat you with a touchdown or tie you with a field goal.  Miss it, and your opponent will have good field position and now can beat you with a field goal.  Perhaps punting is the better option:  you gain field position and if you defend successfully, you get the ball back and now all you need is a field goal to win.

Even more interesting is a short field goal attempt on the initial possession.  Make it, and your opponent still gets field position and a chance to beat or tie you.  Why not go for a touchdown?   You win outright if you succeed, and if you don’t, not only does your opponent get poor field position, but if you defend successfully you’ll only need a field goal to win.

Because of the altered values of touchdowns and field goals mentioned above, I think 4th down strategies on the initial possession should be modified as well.  As complex as it is, at least the new system reverts to the old ruleset after (at most) two possessions.

As interesting as the many consequences of these rule changes are, I still think the “first to six” idea makes more sense.  We’ll see what happens this weekend! 

Related Posts


Baseball Bailouts

Baseball MoneyThere’s an interesting article in the NYT about the economics of baseball’s revenue-sharing system.

The revenue-sharing system is essentially a robin-hood style redistribution of baseball income, taking money from the most profitable teams and dividing it up among the least profitable.   The system, in theory, gives smaller-market teams a chance to compete with their big-market brethren by providing them with addtional cash to invest on players.  But are the recipients of these baseball bailouts really using the money to improve their teams?  Thanks to an anonymous leak last summer, the public was given an unprecedented look at some MLB financial information.

It was quite interesting to see that the Pittsburgh Pirates, who not only have posted a league-record 18 consecutive losing seasons but also rank near the bottom of the MLB in both popularity and team payroll, have actually been quite profitable the past few years.  For example, in 2007 and 2008 the Pirates, who routinely traded away their best players, not only made around $30 million in profit but also collected around $70 million in revenue sharing payouts!

Maybe the owners of the Pirates have figured out that spending their yearly $35 million bonus on players doesn’t increase revenue enough to make it worthwhile.  Why not just take the safe money?  Not a bad year for a business that hasn’t seen success in two decades.

Scattered Popularity in Baseball

I enjoyed reading through this marketing document from Harris Interactive about the popularity of Major League Baseball.  Lots of interesting facts about who watches baseball (higher percentage of people in the East versus other regions; percentages rise with income), and a nice ranking of the league’s most popular teams.

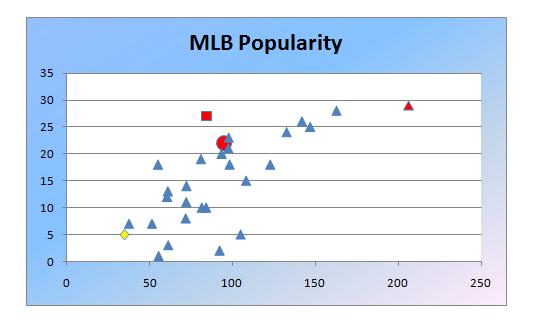
Putting the popularity rankings together with team salary information, I made myself a nice little scatter plot.

MLB Popularity Regression

Team payroll along the horizontal is in millions, and the popularity is out of 30 teams, with 30 being “most popular”.

Not too hard to guess the red triangle in the upper right:  first in popularity and team payroll, your New York Yankees!  The World Series Champion San Francisco Giants are the big red circle around (93,23).  And kudos to the Atlanta Braves, the nice red square in the top middle, as they seem to be getting the best popularity return for their payroll dollars.  The sad yellow diamond in the bottom left is for one particular reader:  maybe next year!

There does seem to be a positive relationshp between the amount spent on salary and the team’s overall popularity, but there are probably a lot of reasons for that.

Lots of other interesting ways to slice and dice this data.  Take a look at the document and try it yourself!

Football Calculator

football calculatorIn an ESPN blog-post, Bill Belichick’s decision to go for it on 4th down against the San Diego Chargers was analyzed, and the ultimate conclusion was that, by a few percentage points, this was wrong decision.  Last season, Belichick was second-guessed after a similar decision led to a Patriot loss to the Colts.  Interestingly, a similar analysis deemed that particular decision to be correct.

The idea of applying serious risk-reward analyses to football seems to increasing in popularity, even though a rigorous study by a world-class economist was conducted nearly 10 years ago .

The author at ESPN utilized a Win Calculator at the Advanced NFL Stats website.  It’s a pretty cool idea–input the current score, time remaining, quarter, field position, down and distance, and the calculator returns Win Probability, Expected Score, and some other projected data.

Of course, the devil’s in the details–that is, the algorithms–but it’s cool to see the quantitative analysis of sports continue to spread.

Reality Sports

madden screenshotThis is an interesting post about testing the “reality” of video games:

http://dubiousquality.blogspot.com/2010/10/back-now-with-100-more-broken.html

After running numerous computer v. computer matchups in Madden football (at various coaching settings), statistical averages from the video games were compared to real NFL averages.  For example, total points were 4.4% lower in the computer games; there were 11.3% fewer interceptions, but 10.4% more fumbles.  Based on his analysis, the author concludes that the game-play is not realistic enough.

The majority of the post is actually a rant about the abundance of advertising in this particular video game.  By that measure, I’d say the game is very realistic.

Follow

Get every new post delivered to your Inbox

Join other followers: