Salary Cap Circumvention

In a heretofore unprecedented (?) move, the National Hockey League has rejected a contract between a player and a team.  In this case, the NHL is trying to void the 17-year, $102 million contract between Ilya Kovalchuk and the New Jersey Devils.  The NHL isn’t commenting right now, but they obviously see this contract as specifically designed to circumvent the spirit of the NHL’s salary cap.  The gaming of the system in this manner has been going on for several years.

The salary cap is essentially a yearly limit on how much a team can spend on its players.  The amount that an individual player counts toward this limit (that player’s “cap hit”) is easy to compute:  it’s the total value of that player’s contract divided by the total number of years on that contract.  In other words, a player’s cap hit is the average salary per year of his contract.

You don’t have to think very hard to figure out how to game this system:  instead of signing a player to a 10-year, $100 million contract, pay them the minimum possible salary ($500K) for 4 extra years and sign them to a 14-year, $102 million contract.  Now, instead of a $10 million cap hit per year, the player has a $7.3 million cap hit per year, allowing the team a lot more financial flexibility.  Do the Devils really expect Kovalchuk to play in year 17 of his contract, when he’s 44 years old?  Probably not.

You could drive a zamboni through this loophole.

Paul’s Perfect Prognostication

Paul the octopus must be enjoying his 15 minutes of fame for correctly predicting the outcomes of eight World Cup matches in a row.  In fact, a stamp in his honor is currently available at the Shanghai World Expo.  This must be a welcome relief from the death threats that followed his [ultimately accurate] prediction of Spain over Germany.

Assuming that the outcome of every match was equally likely (what if you don’t?), then Paul had a 1/256 chance ( that is, (1/2)^8 ) of nailing all eight predictions.  That’s roughly a .4% chance, on the order of getting dealt a straight in a five-card poker hand, or rolling a six three times in a row on a fair die.  Or, if you prefer, exactly equal to the likelihood of flipping a coin and getting Tails (Arms?) eight times in a row.

Apparently octopi have short lifespans, so it doesn’t look like Paul will be around in 2014 to put his record on the line.  At least he’ll go out on top.

Visual Representations of World Cup Final Stats

The NYT’s soccer blog (I can start calling it soccer again, right?) has a nice selection of tools to analyze the stats from yesterday’s World Cup Final:

http://goal.blogs.nytimes.com/2010/07/11/world-cup-live-netherlands-vs-spain/

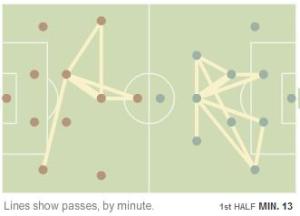
The default is the “Heat Map”, which attempts to show the region of play minute-by-minute.  That’s not nearly as interesting to me as the the “Passes” tab, which appears to detail each possession with an undirected graph, connecting two players with an edge if a pass occured between them (How do we know who passed to whom?  What if two players passed back-and-forth to each other? Why not indicate turnovers in this manner?).    Using a graph like this could certainly help an analyst determine the worth of a player on the field.

There’s also a sidebar that shows various stats from the game.  For example, you can see that the seven players with the highest number of “Touches”, and the top eight in “Passes”, were all Spaniards.  This supports the general description of their style of play (a lot of passing and waiting, I guess).  After looking at those stats for a bit, I couldn’t help but laugh when I pulled up the list for “Goals”.

There’s a lot of statistical analysis here for a game that was tied at zero for two hours.

World Cup Predictions

I went over to ESPN and tallied up the total number of goals in this year’s World Cup:  I counted 139 goals in 62 matches (margin of error:  +/- 3 goals?), for an average of 2.24 goals per match.  That’s total.  For both teams.  Think about that.

Will the final be similar?  The Netherlands has averaged 2 goals per game (12 goals in 6 games)  over the first 6 games of the WC, and Spain has averaged 1.16 goals per game (7 goals in 6 games).  So maybe the final will see closer to 3.16 total goals?

It might be important to also consider these teams goals against average:  the Netherlands has conceded .83 goals per game (5 goals in 6 games), and Spain has only allowed .33 goals per game (2 goals in 6 games).  This simplistic analysis suggests something around 1.16 goals in tomorrow’s final.

My prediction–two total goals.  If I were you I’d take the under.

Follow

Get every new post delivered to your Inbox

Join other followers: