7 Ways to Explore the Math of the Coronavirus Using the New York Times
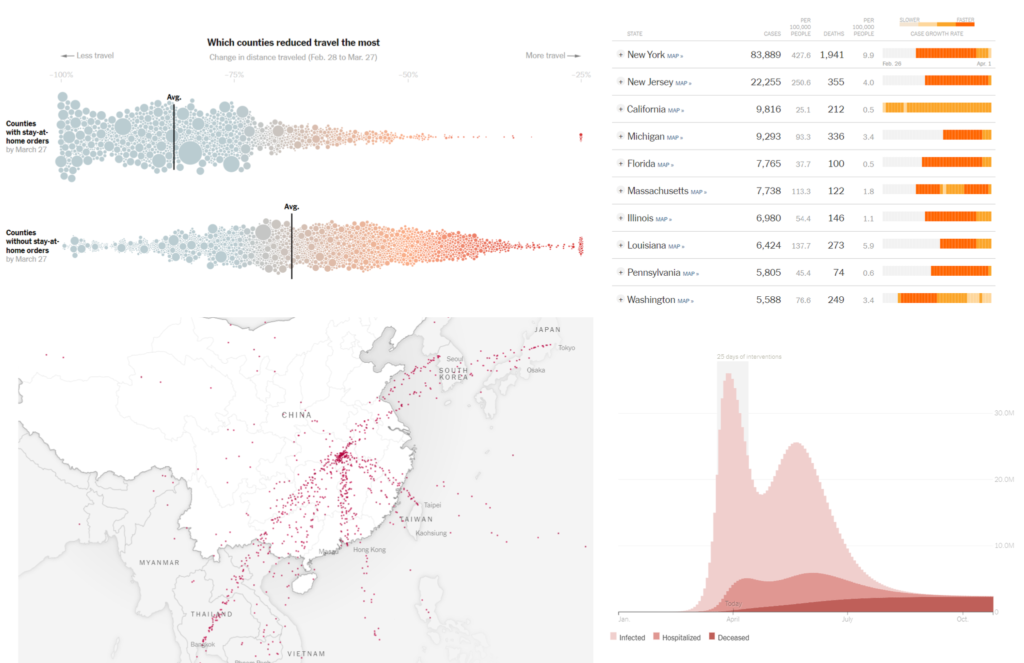
My latest piece for the New York Times Learning Network is “7 Ways to Explore the Math of the Coronavirus Using the New York Times”, a collection of ideas for using NYT articles, infographics, and interactives to explore the mathematics underlying the current coronavirus epidemic.

The opportunities range from statistical literacy to network theory. Here’s an example of some data analysis you can engage in using a wonderful NYT interactive:
By using sliders to change, for example, the level of intervention (e.g., moderate or aggressive) or the length of intervention (e.g., 14 days or 60 days), students can see how outcomes change. And, by playing with the model, they will be able to answer questions like: “What is the impact of shortening our social distancing period?” or “What happens when we delay the start of our interventions?”
The full article is freely available on the New York Times Learning Network.
0 Comments