Scattered Popularity in Baseball

I enjoyed reading through this marketing document from Harris Interactive about the popularity of Major League Baseball.  Lots of interesting facts about who watches baseball (higher percentage of people in the East versus other regions; percentages rise with income), and a nice ranking of the league’s most popular teams.

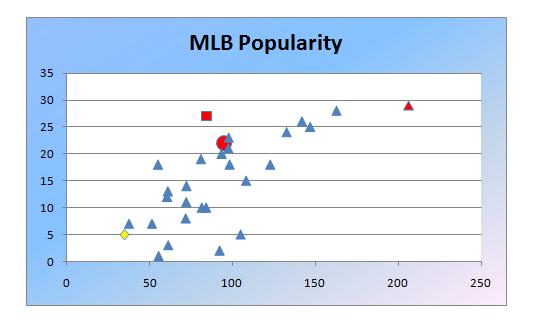
Putting the popularity rankings together with team salary information, I made myself a nice little scatter plot.

MLB Popularity Regression

Team payroll along the horizontal is in millions, and the popularity is out of 30 teams, with 30 being “most popular”.

Not too hard to guess the red triangle in the upper right:  first in popularity and team payroll, your New York Yankees!  The World Series Champion San Francisco Giants are the big red circle around (93,23).  And kudos to the Atlanta Braves, the nice red square in the top middle, as they seem to be getting the best popularity return for their payroll dollars.  The sad yellow diamond in the bottom left is for one particular reader:  maybe next year!

There does seem to be a positive relationshp between the amount spent on salary and the team’s overall popularity, but there are probably a lot of reasons for that.

Lots of other interesting ways to slice and dice this data.  Take a look at the document and try it yourself!
Daylight Saving Time is Mathematically Illogical

I’ve always found daylight saving time confusing, and now I know why:  mathematically, it doesn’t make sense.

As summer turns to winter and our part of the Earth spends less time in the sun, the length of the day contracts.  This kind of transformation is known as a dilation–a shrinking or stretching of something.

The yellow part of the graph represents the amount of sunlight per day.  This part dilates, while the times-of-day on the clock stay fixed.

In order to increase the amount of productive daylight, we translate the times-of-day.  Naturally, this doesn’t change the amount of available sunlight; it simply shifts the clock-times so that more of that sunlight occurs during preferred times-of-day .

Thus, the new day looks like this.

Essentially, daylight saving time tries to counteract a dilation with a translation.  But mathematically, the way to truly counteract a dilation is with another dilation!  Thus, the mathematical logic of daylight saving time is faulty.

Now that I fully understand the source of my confusion, I can rest easier.  And for an extra hour!

Football Calculator

football calculatorIn an ESPN blog-post, Bill Belichick’s decision to go for it on 4th down against the San Diego Chargers was analyzed, and the ultimate conclusion was that, by a few percentage points, this was wrong decision.  Last season, Belichick was second-guessed after a similar decision led to a Patriot loss to the Colts.  Interestingly, a similar analysis deemed that particular decision to be correct.

The idea of applying serious risk-reward analyses to football seems to increasing in popularity, even though a rigorous study by a world-class economist was conducted nearly 10 years ago .

The author at ESPN utilized a Win Calculator at the Advanced NFL Stats website.  It’s a pretty cool idea–input the current score, time remaining, quarter, field position, down and distance, and the calculator returns Win Probability, Expected Score, and some other projected data.

Of course, the devil’s in the details–that is, the algorithms–but it’s cool to see the quantitative analysis of sports continue to spread.

Benford’s Law

Benfords LawThis is an article about the discovery of new sets of data that seem to obey Benford’s Law–a curious mathematical characteristic of the numbers we collect from the world that is really more conjecture than law.

http://www.newscientist.com/article/mg20827824.700-curious-mathematical-law-is-rife-in-nature.html

It seems that in scores of data sets collected from natural phenomena, the numbers we see tend to start with the digit 1 far more often than, say, with the digit 6.  Indeed, statistical analysis shows that when you look at population numbers, death rates, street addresses, lengths of rivers, stock prices, and more recently, depths of earthquakes and brightness of gamma rays, the observed numbers start with the digit 1 about 30% of the time.  The occurences of other digits as the leading digit fall as you go up the scale.

Apart from being a natural curiosity, Benford’s Law has proven to have some very useful applications.  Scientists can use Benford’s Law to help predict phenomena and look for trends in data, as the rule gives number-crunchers an idea of what they might be looking at from the start.

Additionally, Benford’s Law has been successfully used to identify all kinds of numerical fraud–tax fraud, voter fraud–because when people are faking numbers, they tend to evenly distribute leading digits.  Benford’s Law tells the data-police that if approximately 1/9 of the numbers they are looking start with 1, then something fishy is going on.

Keep that in mind next April.

Reality Sports

madden screenshotThis is an interesting post about testing the “reality” of video games:

http://dubiousquality.blogspot.com/2010/10/back-now-with-100-more-broken.html

After running numerous computer v. computer matchups in Madden football (at various coaching settings), statistical averages from the video games were compared to real NFL averages.  For example, total points were 4.4% lower in the computer games; there were 11.3% fewer interceptions, but 10.4% more fumbles.  Based on his analysis, the author concludes that the game-play is not realistic enough.

The majority of the post is actually a rant about the abundance of advertising in this particular video game.  By that measure, I’d say the game is very realistic.

Follow

Get every new post delivered to your Inbox

Join other followers: