Estimation and Error Propogation

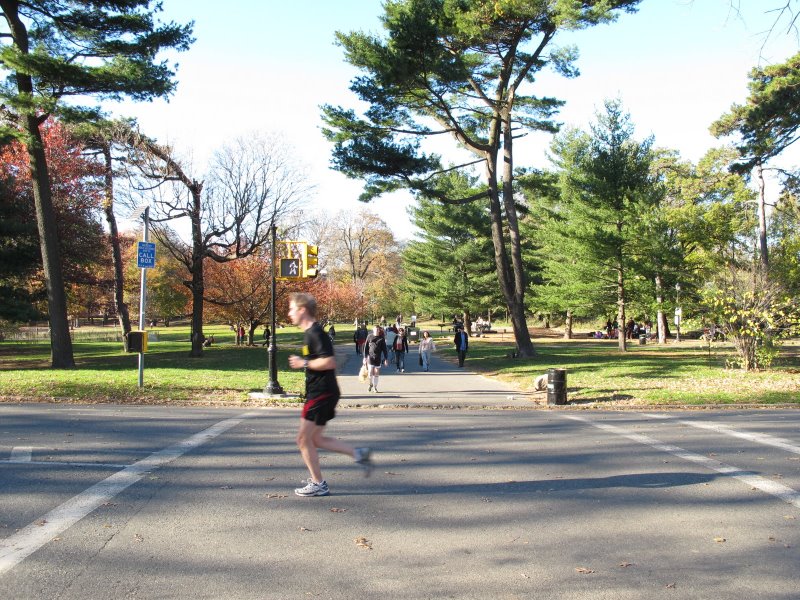
runners 2After using some photographs and some rough estimations to approximate the speed of a runner, I got to wondering “How important is the accuracy of the various estimations?”

In the first solution, I estimated that the height of the runner was 5.75 feet.  I then compared that to the runner’s height in pixel measure, created a pixel-to-feet conversion rate, and used this to calculate the distance the runner travelled during the 1.1 seconds between the two photographs.  Once that distance was determined, the runner’s pace could be estimated at around 9.86 minutes per mile.

But what if I estimate of the runner’s height was off?  And how off would it have to be to make a difference?  Let’s say that the runner’ s height is actually 6 feet, and so my original estimate was off by .25 feet.  How will this affect the final result?

The runner’s rate was originally calculated to be 590 pixels-per-second, and this is not affected by the estimate of the runner’s height.  But if the runner’s real height was 6 feet, then the pixel-to-feet conversion rate is really 380-to-6, which means the runner’s rate translates to about 9.32 feet per second (intead of 8.93 feet per second, as originally calculated).

Following through with the calculations under this new height approximation, the runner runs one mile in  9.45 minutes.  Therefore, if my height estimate was off by .25 feet, then my minutes-per-mile estimate is off by about .41 minutes.  In both cases, this represents a difference of about 4%.

It makes sense that the percentage change is the same, as all the mathematical operations being done here are linear.  The change in the input of 4% just keeps getting passed through every process without alteration, and eventually comes out as a 4% change in the output.

Related Posts

Cross-Section of a Run, Part II

Recently I posted two photos of a runner taken 1.1 seconds apart and asked readers to speculate as to how fast he was running.  Here is one proposed solution.

Using a photo utility, I merged to two photos into one. new runners 1

You can definitely see the seam between the two photos, but what’s important here is that the geometry of the two photos seems consistent.  In other words, I claim that I haven’t altered any distances by pasting the two pictures together.

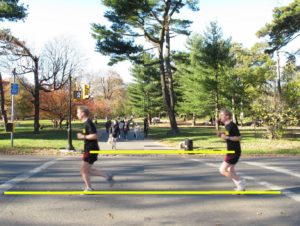
I then used the photo utility to measure in pixels the distance between two similar points on the runner and the runner’s height.  The orange lines are here to illustrate the measurements.

new runners 2

The distance from hip-to-hip is about 650 pixels.  Since the photos were taken 1.1 seconds apart, this means that the runner’s pace is around 650 / 1.1 , or 590 pixels per second.

The runner’s height is 380 pixels.  How tall do we think the runner is in real life?  Well, he doesn’t look that tall, and he’s hunched over a bit in his runner’s stance.  I’m estimating his height, the vertical orange bar, to be around 5.75 feet.   This gives us the following scale factor:  380 pixels is about 5.75 feet.

We can now easily convert the rate from pixels per second into feet per second.  Using the above scale factor, 590 pixels should be around 8.93 feet, so the runner’s speed is approximately 8.93 feet per second.  Now that we have a meaningful rate to work with, we can easily complete the problem with some straightforward calculations.

So how long will it take to run a mile at this rate?  By my calculation, about 9.86 minutes.

Related Posts

Sharks, Geometry, and Optimization

Whale SharkSome recent research sheds light on the interesting mathematics of how whale sharks move through the ocean.

Covering vast empty spaces between resources forces the shark to be natural optimizers when it comes to energy usage.  For example, due to its natural negative buoyancy, the shark tends to sink in the ocean, meaning that ascending through the water requires greater energy expenditure.

In order most efficiently move through the water, the shark naturally gravitates to two general kinds of ascents.  According to the article, the two techniques are a low-angle ascent that tends to minimize energy expenditure per unit of ascent, and a steep ascent that tends to maximizes the vertical change per unit energy.

It’s no surprise that nature is full of optimizers.  Making the most of your resources goes a long way to survival!

You can read the full article here.

Testing the Testers

mc testThe SAT has long been a thorn in the side of students, parents, and teachers everywhere.  At some point it became the standard for establishing academic potential, and we’ve been forced to deal with it ever since.

It’s almost too easy to loathe the SAT and its administrative body, the College Board:  they rake in billions in revenue for providing an assessment that is of debatable value; they have helped create a mindset and industry around the idea of “test prep”;  and the College Board has positioned itself as a significant voice in education policy.  Worst of all is that, at their heart, they are a secretive entity accountable to no one.

Which makes stories like this all the sweeter.

http://abcnews.go.com/GMA/ConsumerNews/teen-student-finds-longer-sat-essay-equals-score/story?id=12061494

A smart high school student, Milo Beckman, had a hypothesis about the essay component of the SAT:  he thought that longer essays earned higher scores, independent of quality.  So he took a poll of his classmates, correlated the length of their essays with their eventual scores, and ran a regression analysis on the data.  The results?

Milo says out of 115 samples, longer essays almost always garnered higher scores.

“The probability that such a strong correlation would happen by chance is 10 to the negative 18th. So 00000 …18 zeros and then (an) 18. Which is zero,” he said.

And Milo’s hypothesis seems in line with the opinions of some other prominent SAT critics.

Maybe these important exams are being so closely examined?

Follow

Get every new post delivered to your Inbox

Join other followers: