Torus Games

Ever wonder what it would be like to play chess on a donut?  Well, wonder no further:  here’s a free set of simple games all redesigned to be played on a torus.

http://www.geometrygames.org/TorusGames/

A torus is a geometric surface that is basically equivalent to a donut (the surface of the donut; not the interior).  One way to [theoretically] construct a torus is to take a flat piece of paper, roll it into a cylinder by gluing the two opposite edges together, and then curling the cylinder into circle and gluing the two circular ends of the cylinder together.
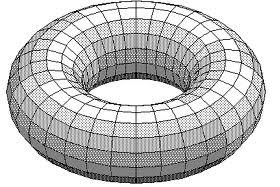
So how do you play pool on a torus?  As the image to the right suggests, if you shoot the ball toward the top edge of the table, it will wrap around and come out the bottom.  The sides similarly wrap around, too.

This strange geometry definitely creates new strategic options in Chess and Tic-Tac-Toe, and this free set of games also include Word Search and Crossword.

A simple, thought-provoking idea.  And free and fun to boot!

Poor Metrocard Management

As one who prides himself on his quantitative reasoning abilities, I am embarrassed at how poorly I manage my Metrocard.

Ever since I switched from buying unlimited cards every month to purchasing cash cards as needed, I’ve been having serious problems.  I really don’t plan ahead, so I’m usually in a rush when I discover that my current card has run out.  When this happens, I’ll just quickly buy a new card with $50 on it, without thinking through the quantitative consequences.

A single ride costs $2.25.  In addition, there is a Bonus system in place where you get additional credit for putting money on your card.  It’s obviously too complicated for me to work out, because I keep ending up with cards that have less than $2 on them.

There are three of them in my wallet right now.

The value of my current card actually ends in $0.10.  I honestly have no idea how that happened.

I guess it’s time for me to review my own post about maximizing Metrocard management.

Mathematically Modelling Collusion

This is a fascinating application of graph and network theory:  modelling corporate inter-connectedness and measuring the influence of large corporations around the world:

https://www.newscientist.com/article/mg21228354-500-revealed-the-capitalist-network-that-runs-the-world/?ignored=irrelevant

A team of complex systems analysts created a map of how 40,000 transnational companies are connected to each other.  Using quantitative factors (like amount of shares of company X held by company Y, and the economic relative strength of company X), the team developed a way to measure the influence a company exerts over another.

In addition to looking at individual companies, this measurement for the evaluation of the system as a whole in terms of equity and stability.  The team found that a sub-network of 147 tightly knit companies exerted a disproportionate influence over the entire network.  The high level of interconnectedness of this group concentrated power in the network, allowing this small group of less than 1% of the companies to effectively control 40% of the network.

An innovative application of mathematics to the fields of economics, politics, and social justice!

Superbowl Scoring

After enjoying a well-contested Superbowl that seemed to appropriately represent the teams, the season, and the league in terms of the level of play and competitiveness, I started wondering about how the big game compares to regular season play.  I wondered if teams performed better or worse, on average, given the pressure and scrutiny of the championship game.

I thought a simple place to start examining this question would be to look at Superbowl scoring versus regular season scoring.  Below is a chart showing the difference (Superbowl Score – Average Regular Season Score) for all 46 Superbowls.

At the far right, we see the results of Superbowl 46:  Giants 21, Patriots 17.  The league average in scoring this years was 22 points per game, so the difference here is 38 – 44 = -6.

It seems as though it is more common for more points to be scored in the Superbowl than in an average regular season game.  Unfortunately, there are a lot of stories one could tell about why that might be so:  better teams (and therefore better offenses) make it to the Superbowl; defenses are more susceptible to pressures of the big game; the extra preparation time gives offensive coordinators and advantage.

So how could we more rigorously explore the quantitative characteristics of the Superbowl?

Follow

Get every new post delivered to your Inbox

Join other followers: