Facebook Formulas

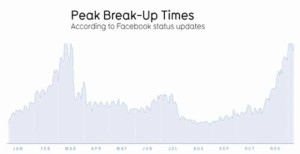
peak breakup timesThis graph on the right represents break ups per day, as determined by an analysis of Facebook status changes.  The data suggests that break-ups seem to occur most frequently in mid-February and late November.

Drawing conclusions from data is always dicey, and there are probably a lot of holes to poke in the methodology here, but it certainly is fun trying to attach meaning to these numbers!

This graph was featured in a TED Talk given by David McCandless, who runs the wonderful website www.informationisbeautiful.net.

The whole talk can be found here; this chart comes up at around the 6:50 mark.

The amount of data available through social networking sites is mindblowing, and it can’t be long before it will be used in some significant way.  Indeed, a group of MIT students has already devised a system, cleverly titled Project Gaydar, that, with some accuracy, identifies the sexual orientation of a Facebook user based on friends, likes, and other connections.

What will they compute about us next?
Cofffe and Cream — A Straightforward Solution

I offered a classic mixture problem–Coffee and Cream–and I suppose it is appropriate that the poll results show a mixture of opinions.  Although one answer clearly seems to be the favorite, there is still strong support for the other two options.  I offer here one approach to solving this classic conundrum.

We begin by adopting a powerful problem solving strategy, one that when used incorrectly can lead to disaster, but when used properly, can turn hard problems into simple ones:  we make a wish.

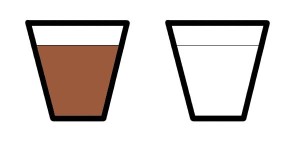
In the statement of the Coffee and Cream problem, no real mention of measurements were made, and, since all the results are ratios anyway, we can wish for whatever starting amount we want.  So, let us wish that each cup contains 10 spoonfuls, and proceed from there.coffee and cream solution 1So there are 10 spoonfuls of coffee on the left, and 10 spoonfuls of cream on the right.  We take one spoonful of cream, and add it to the coffee.coffee and cream solution 2There are now 11 spoonfuls of liquid in the cup on the left:  10 spoonfuls of coffee and 1 spoonful of cream.  Thus, the cup on the left is 1/11 cream and 10/11 coffee.  Now we mix.coffee and cream solution 3Mixing doesn’t change the amounts of coffee and cream in the cup:  the cup on the left is still 1/11 cream and 10/11 coffee.  So we take one spoonful of that, and add it to the cream.coffee and cream solution 4The cup on the left once again has 10 spoonfuls of liquid, and that liquid is 1/11 cream and 10/11 coffee.  So of the liquid on the left,  1/11 of 10 spoonfuls, or 10/11 of a spoonful, is cream.  In other words, there is 10/11 of a spoonful of cream in the coffee.

Now the cup on the right also again has 10 spoonfuls of liquid in it.  How much of that is coffee?  Well, the only coffee in the cup on the right came from the one spoonful of mixture we just added.  And that mixture is 10/11 coffee! coffee and cream solution 5Whether we mix it up or not, there is now 10/11 of a spoonful of coffee in the cream.

Related Posts

Proofiness

ProofinessThis is a short interview in the NYT with Charles Seife, the author of “Proofiness:  The Dark Art of Mathematical Deception”.

http://well.blogs.nytimes.com/2010/10/29/the-dark-art-of-statistical-deception/

Trading on Colbert’s clever coinage–Truthiness–Seife’s book apparently address the myriad ways that the misrepresentation and misinterpretation of statistics negatively affects medicine, economics, politics, justice, and other aspects of society.

It’s not clear that this book is covering any ground that hasn’t already been covered in, say, How to Lie With Statistics (an amusing classic!) or the engaging and readable work of John Allen Paulos, but hopefully the more the issue is raised, the more seriously it will be taken.  The consequences of innumeracy, and general scientific illiteracy, are profound and far-reaching, and they affect us all.

Proofs Without Words

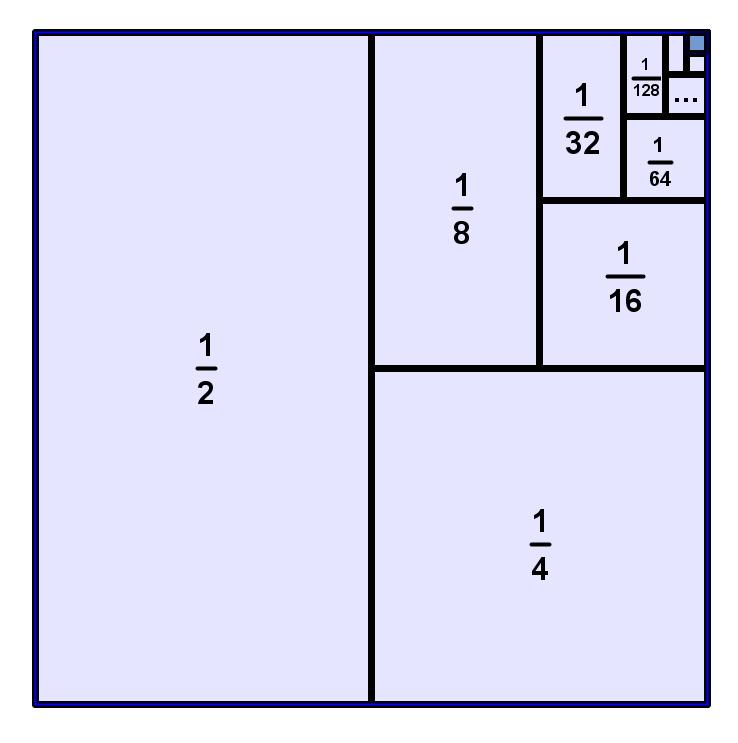
Here are two of my favorite Proofs Without Words.  I’ve been thinking about infinite geometric series a lot lately, and these are two lovely, well-known, visualizations of two amazing infinite sums:

infinite series -- square

In a square of side length 1 (and therefore, area 1), cut the square in half; then cut one half in half (that’s a quarter); now cut one of the quarters in half (that’s an eighth); and so on and so on and so on (this puts the infinite in infinite sum).  Eventually you’ll fill up the whole squareSo this is a demonstration of the following amazing, and somewhat counterintuitive, fact that

infinite series sum 1

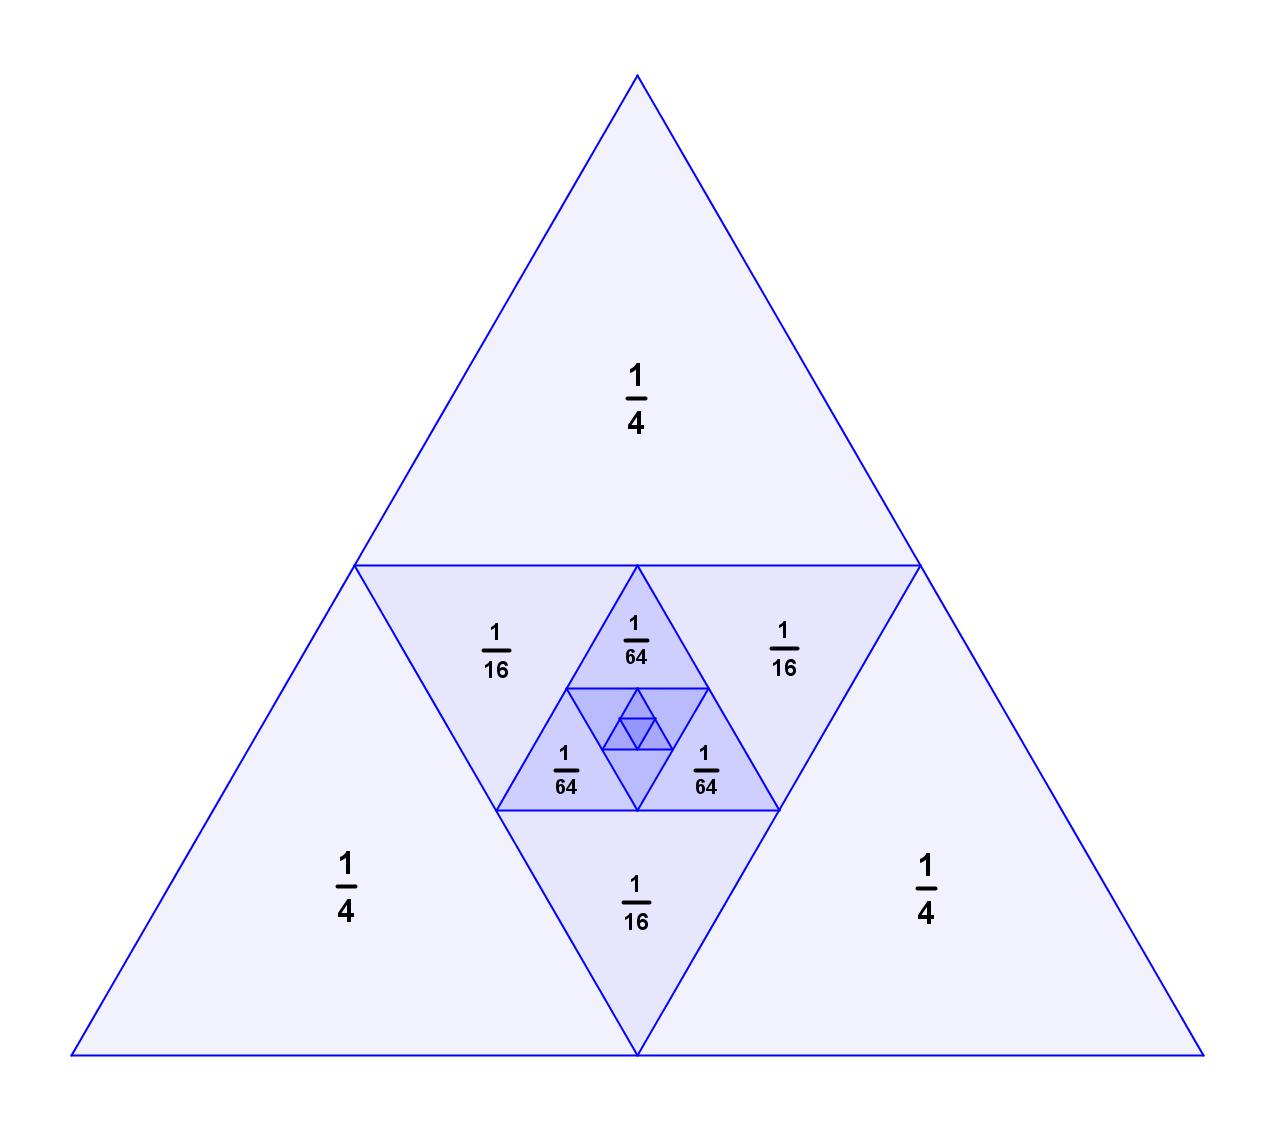
Similarly, this diagram

infinite series -- triangle

is a visual representation of the following sum:

infinite series sum 2

As any good, lazy mathematician would say, the details are left to the reader.

Related Posts

Follow

Get every new post delivered to your Inbox

Join other followers: