When a Model Isn’t a Model

On the one hand, it’s good that standardized math tests are trying to include more examples of mathematical modeling, one of the true applications of math to the real world. On the other hand, if these tests promote a false, even dangerous, idea of what a mathematical model is, then they shouldn’t bother trying.

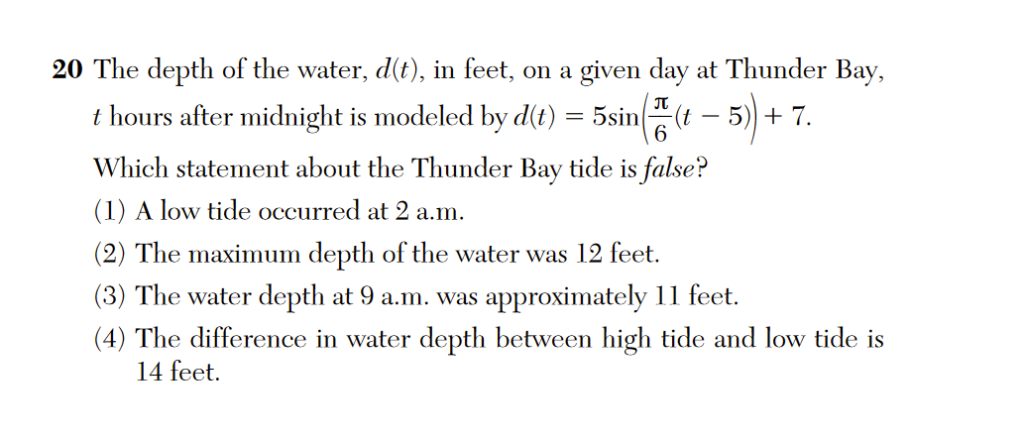
This question from the New York State Algebra 2 Regents exam commits a fundamental error of mathematical modeling: it confuses the model for the phenomenon itself.

Is the maximum depth of the water 12 feet? We don’t know. The model of the water’s depth, d(t), takes a maximum value of 12 feet, but the model is only an approximation of reality. The actual maximum depth of the water is likely to differ from the model, as are the times of high and low tide. We can’t draw specific conclusions like (1), (2), or (4), we can only approximate. This means that all these statements are probably false.

Oddly enough, answer choice (3) seems to understand that models are just approximations, which makes the other answer choices even less defensible. (And all of this ignores the question of whether or not students have the requisite domain-specific knowledge of oceanography to understand what high- and low- tides are.)

In the grand scheme of these exam errors, this is a minor footnote. But as I’ve argued in these posts, and in my talk g = 4, and Other Lies the Test Told Me, these kinds of errors have a cumulative effect of training students to stop thinking when doing and applying math and instead just try to guess what the question writer wants to hear. We should expect more from our assessments.

Related Posts

Why Claude Shannon Would Have Been Great at Wordle — Quanta Magazine

My latest column for Quanta Magazine uses the viral word game Wordle to explore the basic ideas of information theory, the branch of mathematics developed by Claude Shannon that revolutionized fields as diverse as digital communication and genetics.

Wordle is a perfect place to discuss the way Shannon defined “information” to posses certain important mathematical properties, like additivity and and inverse relationship with predictability.

For example, how would you proceed if your Wordle guess came back like this?

What you guess next says a lot about you both as a Wordle player and as an information theorist. To learn more, and maybe even level up your Wordle game, read the full article here.

Introducing Painless Statistics

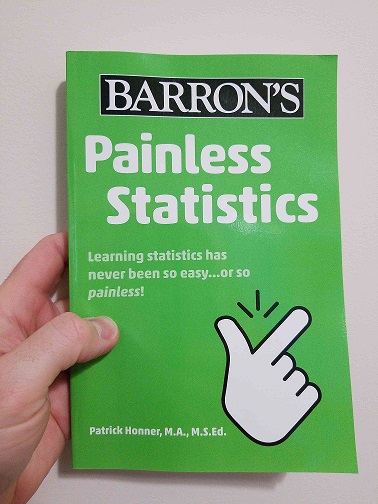
I am thrilled to announce the release of my new book, Painless Statistics!

Painless Statistics, an entry in the Barron’s Painless series, is written to serve as both a supplementary resource for students taking statistics in school as well as a stand-alone resource for adults who are learning (or re-learning) stats on their own.

Painless Statistics begins with an example of working with data, and covers everything from summary statistics and representations of data to sampling distributions and statistical inference. The book also includes plenty of problems that get you thinking about and applying the important ideas in each chapter.

My hope is that Painless Statistics can be a useful resource for middle school, high school, and even college students learning statistics, as well as for lifelong learners interested in understanding the fundamental mathematical ideas at the intersection of statistics, probability, and inference.

I also think the book would be a great resource for any math teacher who might not see themselves as a statistics teacher but would like to better understand the fundamental ideas in statistics. If by reading Painless Statistics you learn 10% of what I learned by writing it, I think you’ll find it a worthwhile purchase.

If you or someone you know is learning statistics, or would like to learn statistics, please consider picking up a copy of Painless Statistics! It will be available in bookstores everywhere starting June 7th, and you can also order it online. I’ve included the Table of Contents below, and you can take a look inside at the first chapter here.

Painless Statistics Table of Contents

Chapter One: An Introduction to Data

Chapter Two: Data and Representations

Chapter Three: Descriptive Statistics

Chapter Four: Distributions of Data

Chapter Five: The Normal Distribution

Chapter Six: The Fundamentals of Probability

Chapter Seven: Conditional Probability

Chapter Eight: Statistical Sampling

Chapter Nine: Confidence Intervals

Chapter Ten: Statistical Significance

Chapter Eleven: Bivariate Statistics

Chapter Twelve: Statistical Literacy

What a Math Party Game Tells Us About Graph Theory — Quanta Magazine

My latest column for Quanta Magazine explores some deep (and recent!) results in graph theory using a simple mathematical party game. Trying to get your entire group of friends to each shake an odd number of hands leads to some fundamental and surprising results, like the impossibility of some simple configurations.

This also ties in to some recent research that has determined new bounds on the way a graph can be partitioned into subgraphs. You can read the full article here, which includes some fun and challenging exercises at the end.

Follow

Get every new post delivered to your Inbox

Join other followers: