Here’s a short post based on a Twitter thread I wrote about a very underappreciated vector: The all 1s vector!
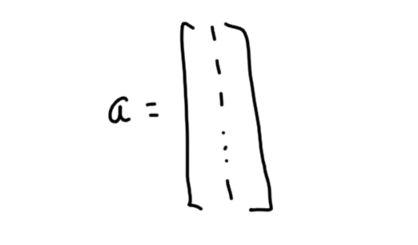
Every vector whose components are all equal is a scalar multiple of the all 1’s vector. These vectors form a “subspace”, and the all 1’s vector is the “basis” vector.
Let’s say you have a list of data — like 4, 7, -3, 6, and 1 — and you put that data in a vector v. An important question turns out to be “What vector with equal components is most like my vector v?”
To answer that question you can *project* your vector onto the all 1’s vector. You can think of this geometrically — it’s kind of like the shadow your vector casts on the all 1’s vector. There’s also a formula for it that uses dot products.
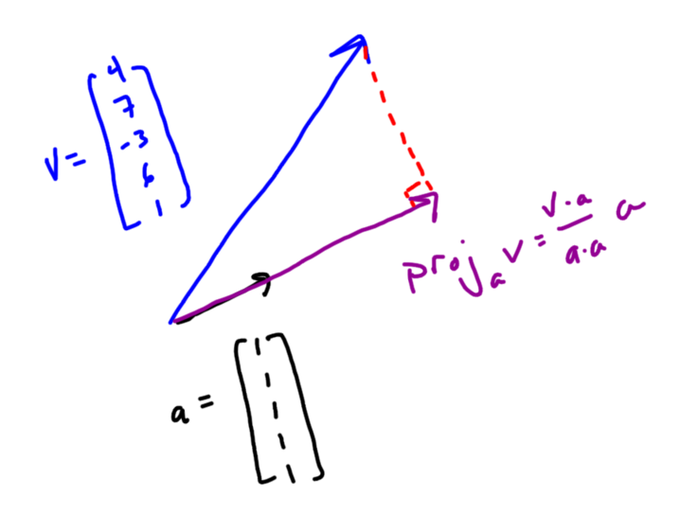
Because of the way the dot product works and the special nature of the all 1’s vector, v•a is the sum of the elements of v and a•a is the number of elements in v. This makes (v•a)/(a•a) the mean of the data in v!
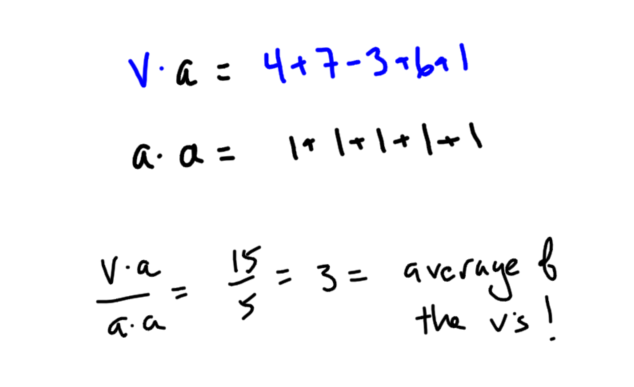
Since 3 is the mean of your data, the vector with equal components that is most like your vector is the all 3’s vector. This makes sense, since if you’re going to replace your list of data with a single number, you’d probably choose the mean.
Now the cool part. Look at the difference in these two vectors: These are the individual deviations from mean for each of your data points, in vector form!
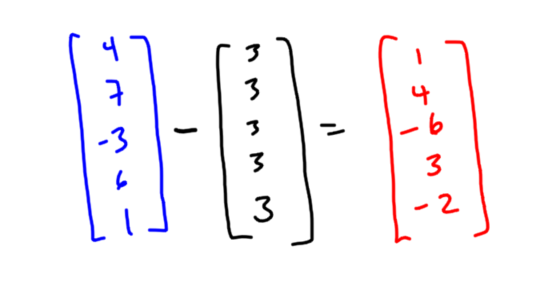
And geometrically this vector of deviations is perpendicular to the all 1’s vector! You can check this using the dot product.
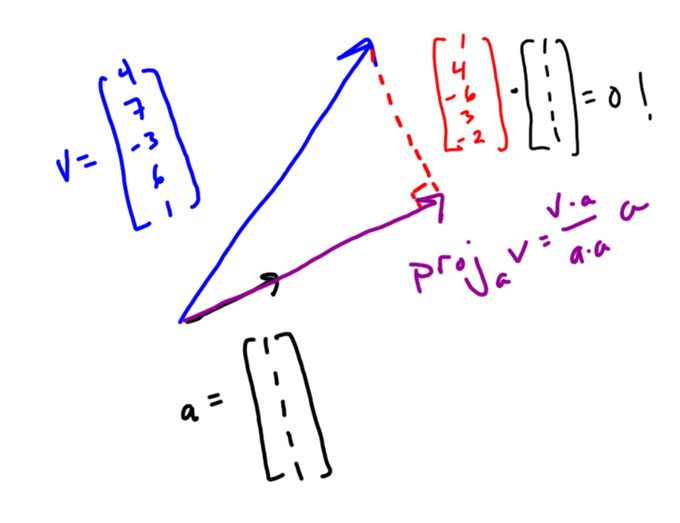
So data can be decomposed into two vector pieces: one parallel to the all 1’s vector with the mean in every component, and one perpendicular to that with all the deviations. You can see hints of independence, variation, standard deviation lurking in this decomposition.
You can check out the original thread on Twitter here, including some very interesting replies!
Related Posts


