 When it comes to educational testing, the stakes are higher than ever. For a student, tests might determine which public schools you can attend, if and when you graduate, and which colleges are available to you. For schools and districts, aggregate test scores and the “progress” they show might determine what kind of state and federal aid is available.
As a means of evaluating teachers, student test scores are playing an increasing role. Indeed, state laws have been re-written to mandate the use of standardized test data as a substantial factor in rating teacher performance.
There is controversy regarding the value of standardized tests, even as measures of student achievement (in most cases, their purported purpose). A very public debate has emerged as politicians attempt to make education more “data-driven” and hold teachers and schools more “accountable”. But one fundamental question is rarely raised in this conversation: are these tests any good?
If the tests we use to evaluate students, schools, and now teachers, are ill-conceived, sloppy, and erroneous, how legitimate a measure of teaching and learning could they possibly be? The issue of test quality and relevance seems like an important one, but it gets very little attention.
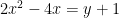
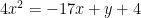
In this series, I address the question “Are These Tests Any Good?” by looking at a collection of questions from the 2011 New York State Math Regents Exams. My cursory analysis reveals many significant issues with how these tests are created: mathematical errors; poorly-worded questions; the de-emphasis of knowledge; and misalignment with course curricula.
If we can’t create legitimate, relevant, appropriate tests, should we really be using them to evaluate teachers? Or students?
Are These Tests Any Good?
Part I: Mathematically Erroneous Questions
Part II: Ill-Conceived Questions
Part III: Underrepresented Topics
Part IV: The Worst Math Regents Question of All Time
Part V: 9th Grade Questions on 10th and 11th Grade Exams
Here are some other resources on this topic.
This blog by JD2718 offers a similar critique of Regents exams from 2009.
Here’s some fun I had with one of this year’s Regents questions involving the famous 13-14-15 triangle.
Related Posts