Here is another installment from my review of the June 2012 New York State Math Regents exams.
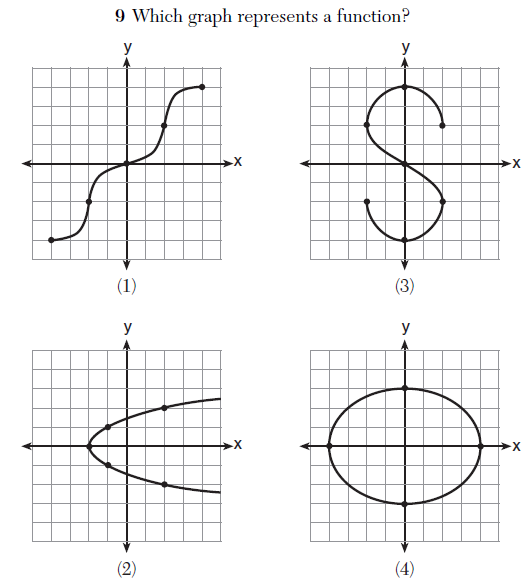
Below is a problem from the Integrated Algebra exam. Which of these graphs represents a function?
Have you identified the function? Well, you’re right, because all of these graphs could represent functions!
What the question presumably intends to ask is “Which of these graphs represents y as a function of x?” Under this interpretation, the correct answer is (1). But in (2), we see a graph that represents x as a function of y. So it, too, represents a function.
Indeed, even graphs (3) and (4) could represent parametric functions. For example, (4) could be written.
This plane curve is a function of t.
I doubt this makes much practical difference in the outcomes on this exam, but precision is important in mathematics; it should be modeled for students on official assessments. And those writing these important exams should be familiar enough with the content to write precise and accurate questions.


